Structural dynamics
Week 2-Assignment 2-Module 3
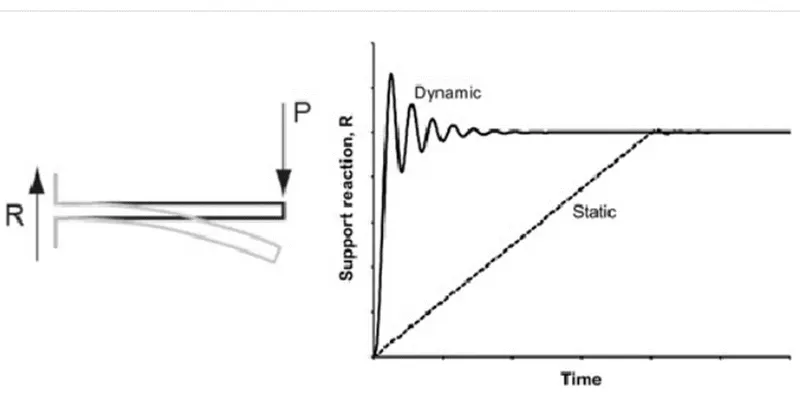
- Refer to below for the differences between Static and Dynamic Analysis with pictorial representation;
- Static refers to the force that has constant size, position and direction on or within a structure while Dynamic refers to a force on a structure that changes size, position or direction.
- Static analysis determines the maximum allowable load to be applied to the structure while Dynamic analysis determines the stresses at the different points of the structure due to changing conditions over time.
- Motion cannot be disregarded in Dynamic analysis in opposed to Static.
- In Dynamic, two additional forces must be accounted such as Inertia and Damping Forces in equilibrium equation it can be disregarded in Static Analysis.
- In Static, the Force does not vary with time in contrast to Dynamic.
- Below is the force-displacement graph extracted from Dynamics of Structures Theory and Applications to Earthquake Engineering A.K. Chopra with the following explanations of the listed behaviors;
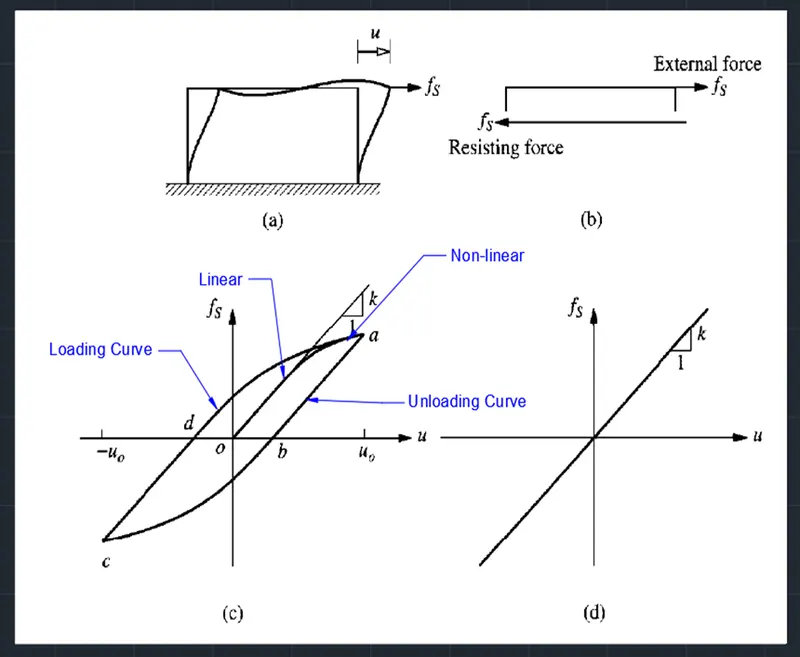
- Elastic Behavior – ability of a deformed material body to return to its original shape and size when the forces causing the deformation are removed. A body with this ability is said to behave (or respond) elastically. From the force-displacement graph at point O to a certain point, it shows linear path, hence the body shows elastic properties at certain limit with the forces applied.
- Inelastic Behavior – deformation of a material that does not disappear on removal of the force that produces it. From the force-displacement graph, inelastic behavior corresponds to the nonlinear path. Inelasticity is experienced by the body as soon as the path going out of the linear curve.
- Plastic behavior - for stresses beyond the elastic limit, a material exhibits plastic behavior. This means the material deforms irreversibly and does not return to its original shape and size, even when the load is removed. When stress is gradually increased beyond the elastic limit, the material undergoes plastic deformation. From the force-displacement graph, plastic behavior corresponds to the unloading curve beyond point a (the maximum limit of inelastic behavior).
- Non-linear Inelastic behavior - Materials have elastic behaviour usually only up to a certain load, which is called the ‘yield point’. After that, the deformations are plastic. From the force-displacement graph, this behavior occurs when the line from point “O” tends to bend to point “a”.
3. Mass, Stiffness & Damping components in the equation of motion are as follows;
- The Single Degree of Freedom System as a combination of 3 pure independent systems such as the stiffness, the damping and the mass component.
- The Stiffness Component – the frame without damping or mass. The external force fs on the stiffness component is related to displacement u by fs = ku, if the system is linearly elastic.
- The Damping Component – the frame with its damping property with no stiffness or mass. The external force on the damping component is related to velocity by fd = ců, where fd is damping force, c is the viscous damping coefficient and ů is the velocity.
- The Mass Component – the roof mass without the stiffness or damping of the frame. The external force fi on the mass component is related to the acceleration by fi = mű
Then, mű + fd + fs = p(t) --à mű + ců+ ku = p(t)
4. Natural period (Tn) & Natural frequency (f) are as follows;
- Natural period (Tn) – is the vibration of the system (Tn) is the time required for the undamped system to complete one cycle of free vibration (Unit is in seconds). It is related to the natural circular frequency of vibration, ωn, in units of radians per second. With, Tn = 2π/ωn or ωn = 2π/Tn
- Natural frequency (f) - number of cycle (or one complete revolution) executed by system in one second with units in hertz. Where, f=1/Tn
- Natural vibration properties ωn, Tn and f depends only on mass and stiffness of the structure.
5. Response spectrum;
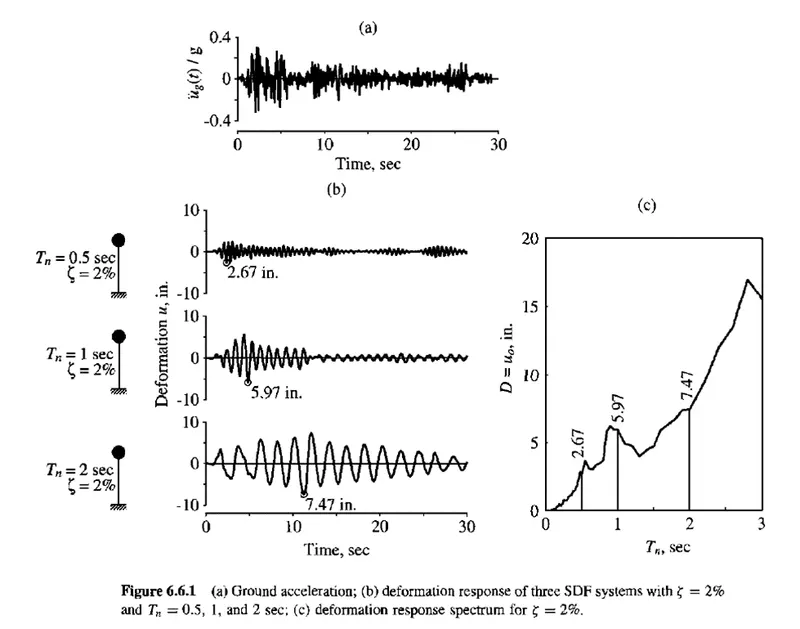
- It’s the central concept in earthquake engineering, provides a convenient means to summarize the peak response of all possible linear SDF systems to a particular component of ground motion.
- It provides a practical approach to apply the knowledge of structural dynamics to the design structures and development of lateral force requirements in building codes.
- A plot of the peak value of a response quantity as a function of the natural vibration period Tn of the system, or a related parameter such as circular frequency ωn or cyclic frequency fn, is called the response spectrum for that quantity.
- Each such plot is for Single Degree of Freedom systems having a fixed damping ratio Շ, and several such plots for different values of Շ are included to cover the range of damping values encountered in actual structures.
- A variety of response spectra can be defines depending on the response quantity is plotted. Consider the following peak responses.
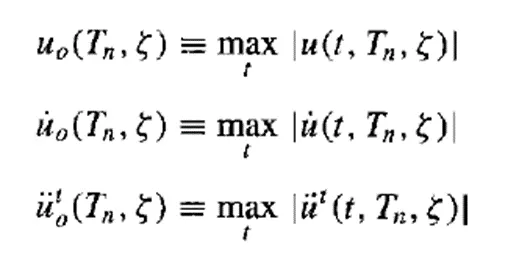
- The deformation response spectrum is a plot of uo against Tn for fixed Շ (damping ration). A similar plot for ůo is the relative velocity response spectrum, and for űto is the acceleration response spectrum.