Salary calculation for different employee levels using machine learning
Aim:
To calculate Salary for different employee levels using machine learning from the given data.
Given Data:
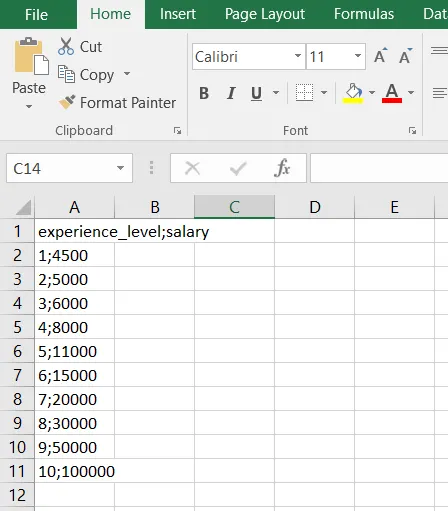
CSV file
Problem analysis:
In this data, we have one independent variable namely experience_level and one dependent variable i.e., Salary. So, in this problem we have to train a Polynomial Regression model with this data to understand the correlation between the Experience Level and Salary of the employee data in the company and be able to predict the salary for the new employee based on this data.
Reason to choose Polynomial Regression:
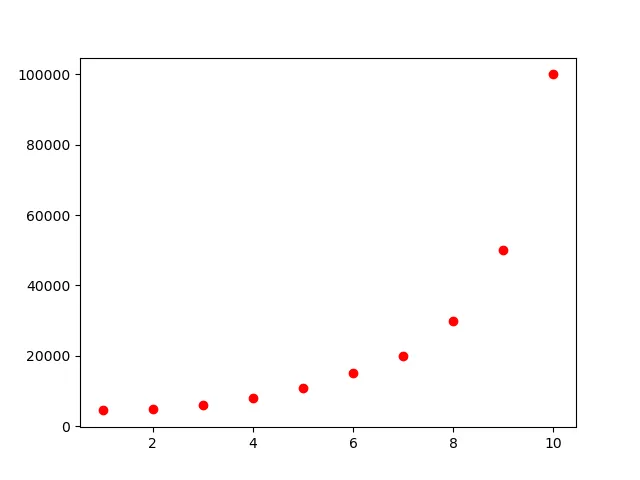
By ploting the given dataset we can identify that the datapoints form non linearity. So are building a polynomial relationship which will accurately fit the data points in the given plot. This is called Polynomial Regression. The formula for a Polynomial Regression curve is given as y=w1x+w2x²+..+b.
Python code:
#Importing the required modules
import pandas as pd
import matplotlib.pyplot as plt
from sklearn.linear_model import LinearRegression
from sklearn.preprocessing import PolynomialFeatures

#Import the data set using pandas into df dataframe
df=pd.read_csv('salaries_dataset.csv',sep=';')
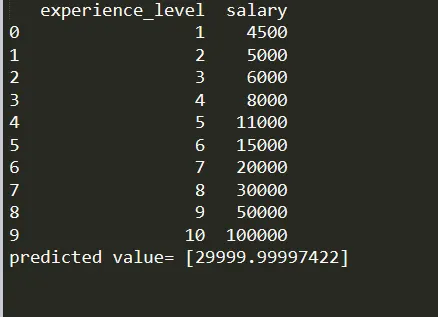
print(df)


#Calling PolynomialFeatures function to create a polynomial regression object
#We specify the degree N of the polynomial when calling this function

polynomial_regression=PolynomialFeatures(degree=10)
x=polynomial_regression.fit_transform(df[['experience_level']])
reg=LinearRegression()
reg.fit(x,df['salary'])
y=reg.predict(x)
plt.plot(df[['experience_level']],y,color='blue',label='polynomial regression')
plt.legend()

#Lets scatter our dataset as points and see if it fits polynomial regression
plt.scatter(df['experience_level'],df['salary'],color='red',label='dataset points')
plt.legend()
plt.show()
df['experience_level'],df['salary']

#Calculating new employee values who has experience level 4.5
x1 = polynomial_regression.fit_transform([[8]])
prediction=reg.predict(x1)
print("predicted value=",prediction)
PROCEDURE:
Step 1: Importing the libraries
In this first step, we will be importing the libraries required to build the ML model. The libraries like matplotlib ,sklearn are imported. Additionally, we have imported the Pandas library for data analysis.
Step 2: Importing the dataset
In this step, we shall use pandas to import the data and store it as a Pandas DataFrame using the function “pd.read_csv”.
We go through our dataset and assign the independent variable (x) to the second column with the column name “Experience Level” and the dependent variable (y) to the last column, which is the “Salary” to be predicted.
Step 3: Training the Polynomial Regression model on the whole dataset
The dataset on which we are using has very few number of rows and hence we train the entire dataset for building the Polynomial Regression model. In this the “PolynomialFeatures” function is used to assign the degree of the polynomial line that we are going to plot. In this, the degree is set as 10.
Step 4: Comparing the Real Values with Predicted Values
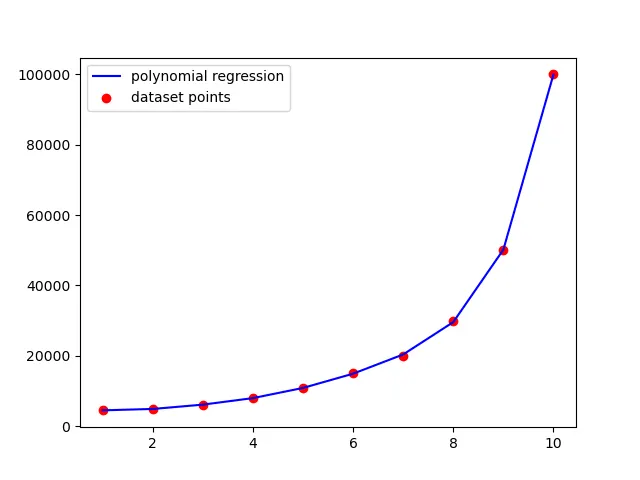
In this step , we shall plot both the Real Values and Predicted Values
We can see that the model has done a great job in fitting the data and predicting the salary of the employee based on the position level.
Step 5: Predicting the Results
In this step, we are going to predict the values Salary based on the Polynomial Regression model built using the code shown above.
OUTPUT: