Roof Strength Test of a Car in Hypermesh RADIOSS.
Roof Strength Test of a Car in Hypermesh RADIOSS.
AIM: To conduct the roof strength test on the given car model in the Hyperworks RADIOSS Solver by following the given instructions
Import
• Car
• Impactor
Transforms
• This will require (in order)
• A 180° rotation about the global z-axis with the point opposite to C as base point
• A 5° rotation about the axis through axis AB
• A 25° rotation about the axis through axis AC
• A translation to put point A at global ( -3500.00, 584.822, 1343.06)
Reference image ( Full Vehicle Model )
Interfaces
• Create a Type 7 contact interface between the impactor and the car
• choose an appropriate stiffness definition
• choose an appropriate minimum gap
• change the coefficient of friction to 0.2
• choose the appropriate friction penalty formulation
• Save the data from the interface to the time history file.
Boundary condition
keep the suspension shock tower nodes locked in Z.
Impactor Boundary Conditions
• The impactor assembly contains a spring attached for stability. Create a BCS
collector to fix the free end of the spring.
• Create a moving SKEW to define the direction normal to the impactor’s
face.
• Create a BCS collector to guide the master node of the impactor rigid body
so that it is free to translate normal to the face of the impactor, but is fixed
in all other DOFs.
Imposed Displacement
• Impose the velocity of the impactor starting from 0 mm/s at t = 0. The
displacement of the impactor should be 200 mm @ 200 ms.
• Avoid abrupt changes in the acceleration of the impactor.
Control Cards
• /ANALY card
• /DEF_SHELL card,
• /DEF_SOLID card, and
• /IOFLAG card
• /SPMD card
• /TITLE card
Engine File
• Use a constant nodal time step
• Print time history every 0.0001 seconds
• Solve for 200 ms
• Create an animation file every 0.005 seconds
Include selected output in animation files:
• Elemental Energy
• Elemental equivalent plastic strain
• Elemental hourglass energy
• Elemental von Mises stress
• Nodal added mass
• Turn on parallel arithmetic
Solution and Results Post Processing
• Run the model
• Plot force vs. displacement. Check that the FMVSS 216 target load of
47,000 N (= 3 * GVW) has been met.
• Plot the energy vs. time curves
INTRODUCTION TO ROOF STRENGTH TEST
Roof strength evaluations consist of a quasi-static test conducted on a vehicle’s roof in a manner similar to tests used to judge compliance with Federal Motor Vehicle Safety Standard 216(FMVSS).
Testing Procedure:
- With the vehicle on a level surface, the on-road pitch angle at the front door sill is measured on both sides of the vehicle.
- Unless the vehicle manufacturer requests otherwise, roof racks and other nonstructural items that may be contacted during the test are left as installed from the factory.
- Any trim or other components are removed if they interfere with supporting the vehicle along its rocker panels. For vehicles with vertical pinch weld flanges on the bottom of the rocker panels, the vehicle support system consists of one I-beam for each rocker panel.
- Each I-beam has a clamping system incorporated on the top that is tightened against the pinch weld flange to clamp the system in place.
- When the pinch weld flange has a bend that prevents supporting the sill with one I-beam, more than one I- beam can be used on each side of the vehicle.
- For vehicles with no pinch weld flange, or with a nonvertical flange angle that precludes clamping, mounting by another method may be necessary, such as that described in the National Highway Traffic Safety Administration’s (2006) Laboratory Test Procedure.
- Prior to testing, the front row seat back on the side being tested is reclined to prevent interaction with the crushing roof.
- Rear seats are latched in their upright position.
- All windows are closed and doors are locked.
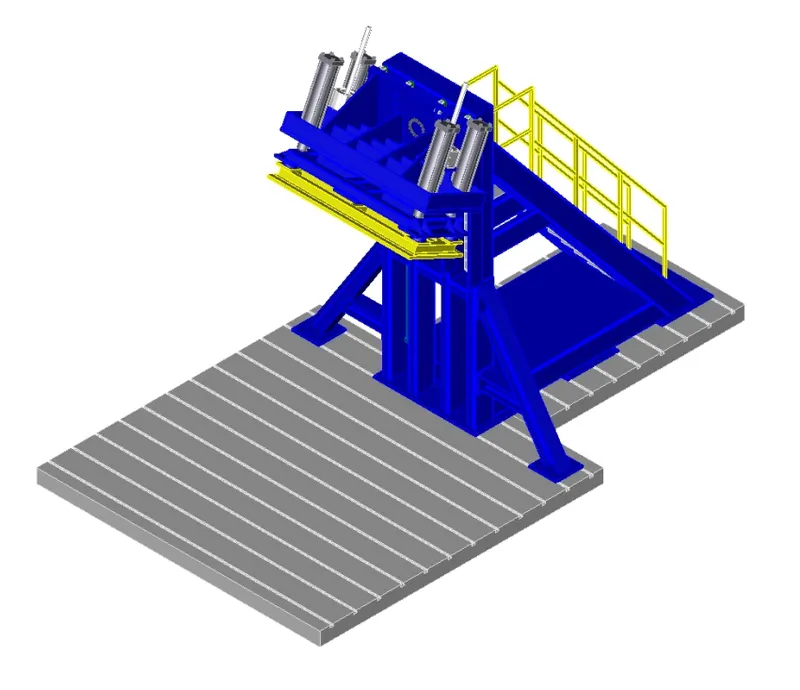
Image 1.1 Roof Strength Testing Rig.
- Roof strength evaluations are conducted on a quasi-static test system manufactured by MGA Research Corporation (Image 1.1).
- The system consists of an upright assembly and attached loading head that can be fixed at varying heights from the ground as well as at pitch angles ranging from -5 to +5 degrees to accommodate testing on the driver or passenger side.
- The roll angle is permanently fixed at 25 degrees. Four hydraulic actuators control the movement of the platen along two linear guides.
- The entire system is mounted on a T-slot bed plate anchored to the floor of the test facility.
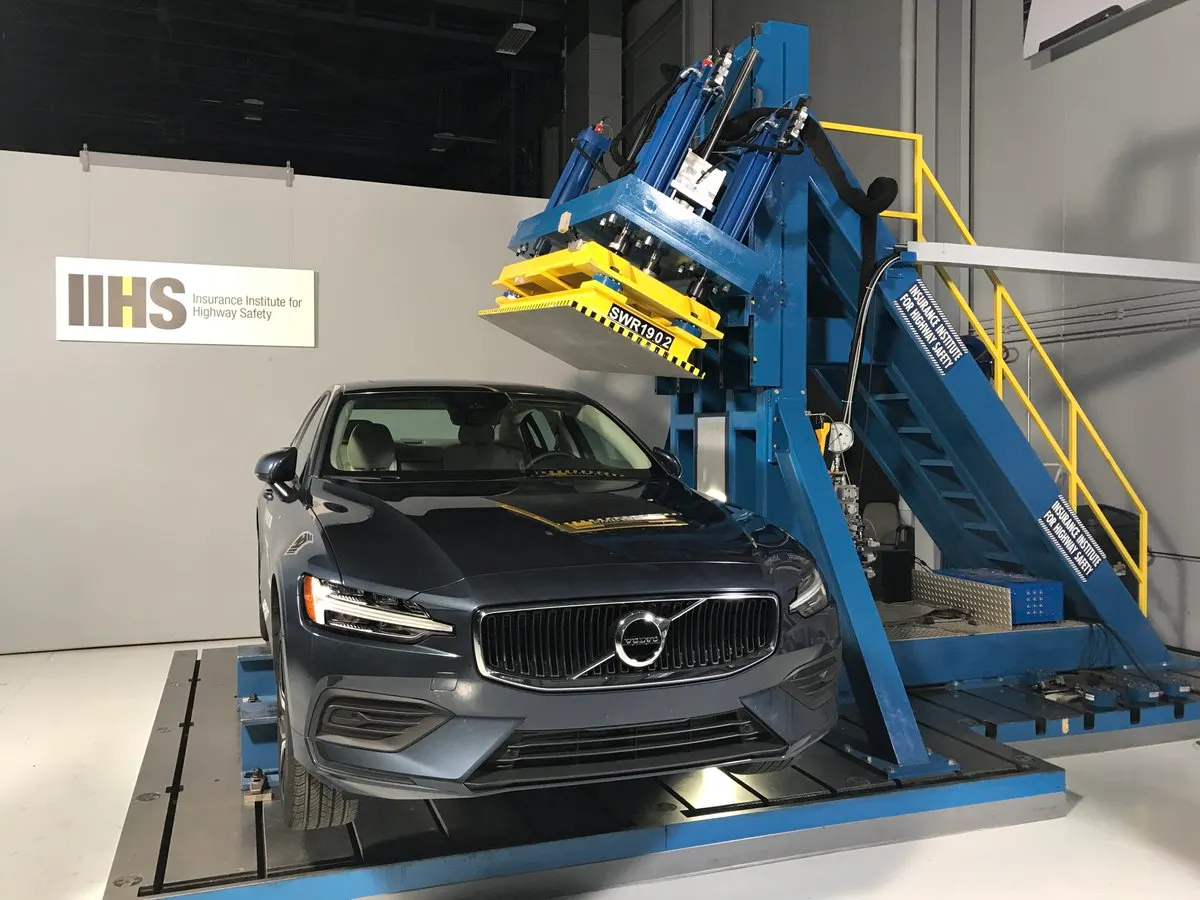
Image 1.2 Roof Strength Test
- The roof is crushed to a minimum displacement of 127 mm at a nominal rate of 5 mm/second.
- Some tests are conducted to a greater displacement to collect additional strength data for research purposes.
- Force data are recorded from five load cells attached to the loading platen.
- Displacement data are recorded from four linear variable displacement transducers (LVDTs) integrated into the hydraulic actuators.
- Force and displacement data are recorded for 5 seconds prior to each test, while the test system holds the loading platen at initial roof contact.
- The maximum force prior to 127 mm of platen displacement is divided by the measured curb weight to obtain the Strength to Weight Ratio(SWR).
- The vehicle’s rating is assigned based on the boundaries listed in Table below.
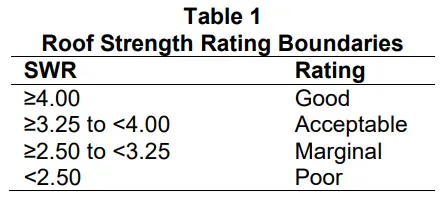
Table 1. SWR rating table
- In the same way this test is conducted virtually in the Hypermesh RADIOSS software.
- Since the Complete car model has nodes more than 300000, which is not supported in Hypermesh Student version, some parts are recreated by using the rigids.
PROCEDURE:
1. IMPORT THE MODEL IN HYPERMESH
- The given model in the form of .rad file is imported in the Hypermesh.
- To Import the model File>Import>Solver Deck> Select the Neon_roof_0000.rad file> Import.(refer the image 1.1)
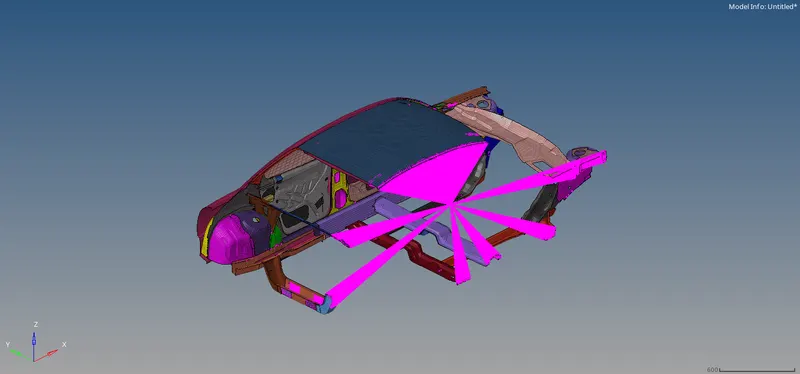
Image 1.1 Importing the model.
- Similarly import the Impactor model.
- Image 1.2 shows the image of the both the model imported in the Hypemesh.
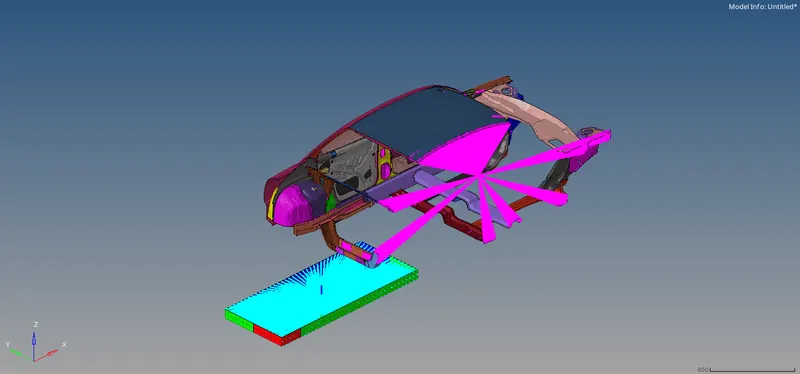
Image 1.2 Car and Impactor.
2. POSITIONING THE IMPACTOR.
- A 180° rotation about the global z-axis with the point opposite to C as base point.(Refer the image 2.1)
- A translation to put point A at global ( 2800.00, 584.822, 1343.06).
- Translation to put point A at the given co-ordinate position tool is used.
- To position the impactor 3 tags were created at A, B and C by Tools> Tags> Select the A node> Set the tag as A> Create(refer the image 2.2) and their distance between those points were known.
- AB = 381mm and AC = 1575mm.(refer the image 2.3)
- Using the distance between the A, B and C nodes 3 nodes were created exactly at the given location i.e A( 2800.00, 584.822, 1343.06), B(2800, 203.822, 1343.06) and C(1225, 584.822, 1343.06).(refer the image 2.4)
- Now using the position tool Tools>Position>Select the Impactor nodes> Select the from nodes A,B and C> Select the to nodes> Position.(Refer the image 2.5)
- A 5° rotation about the axis through axis AB(refer the image 2.6)
- A 25° rotation about the axis through axis AC.(refer the image 2.7)
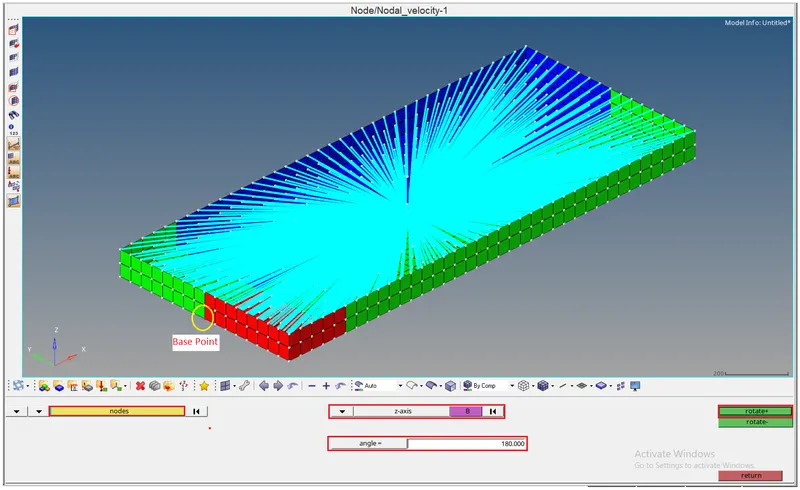
Image 2.1 180° Rotation about global Z axis.
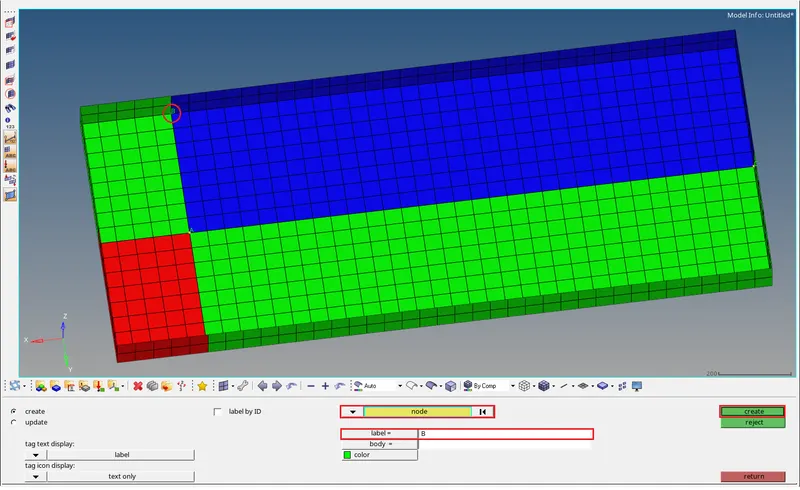
Image 2.2 Creating the Tags
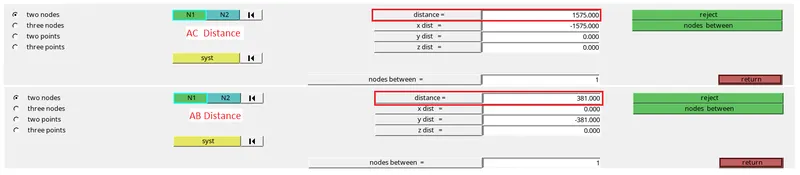
Image 2.3 Distance between the nodes.
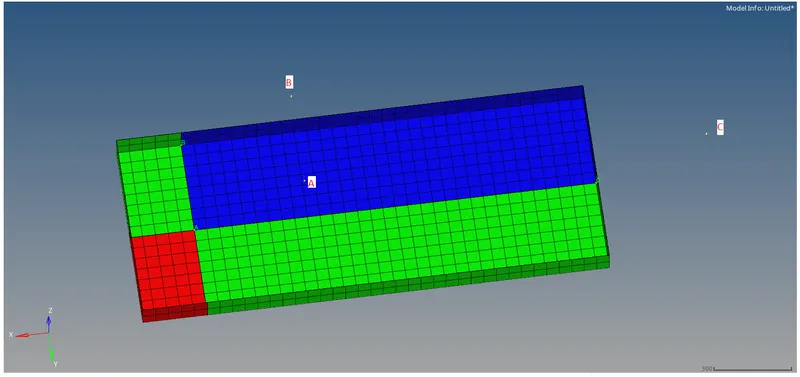
Image 2.4 Creating the A,B and C nodes.
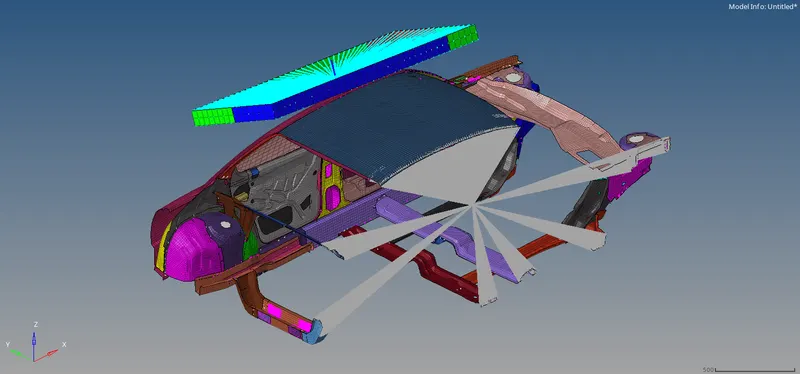
Image 2.5 Position the nodes.
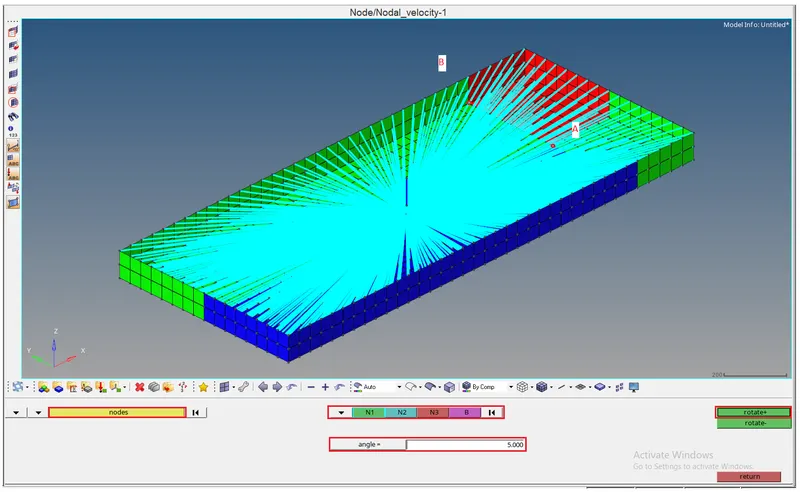
Image 2.6 5° rotation about AB axis
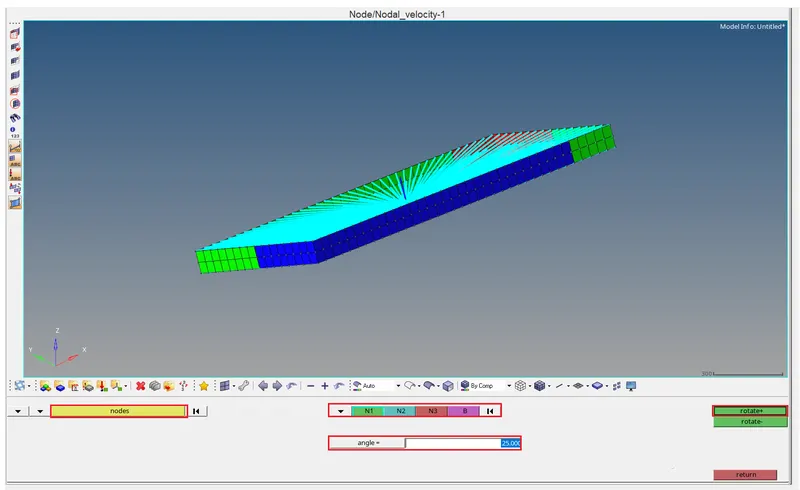
Image 2.7 25° Rotation about AC axis
3. INTERFACE
- For this car model Type 7 contact is given for interface.
- To create the interface in the Model View>Right Click>Create>Contact(refer the image 3.1).
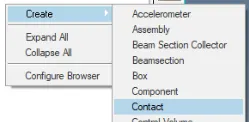
Image 3.1 Creating the Contact.
- In the Contact panel change the parameters such as card image, Istif, Idel,Inacti, Stmin, Gapmin,Fric etc to the recommended value(Refer the image 3.2)
- Select the Gmod_id(S) with all nodes and Surf_id (m) with all elements of the car body. This is for self contact.
- For the Contact between the Impactor and the Car a new Contact is created and in the card the nodes in the car is selected as Slave nodes and the Master surface as the Impactor.
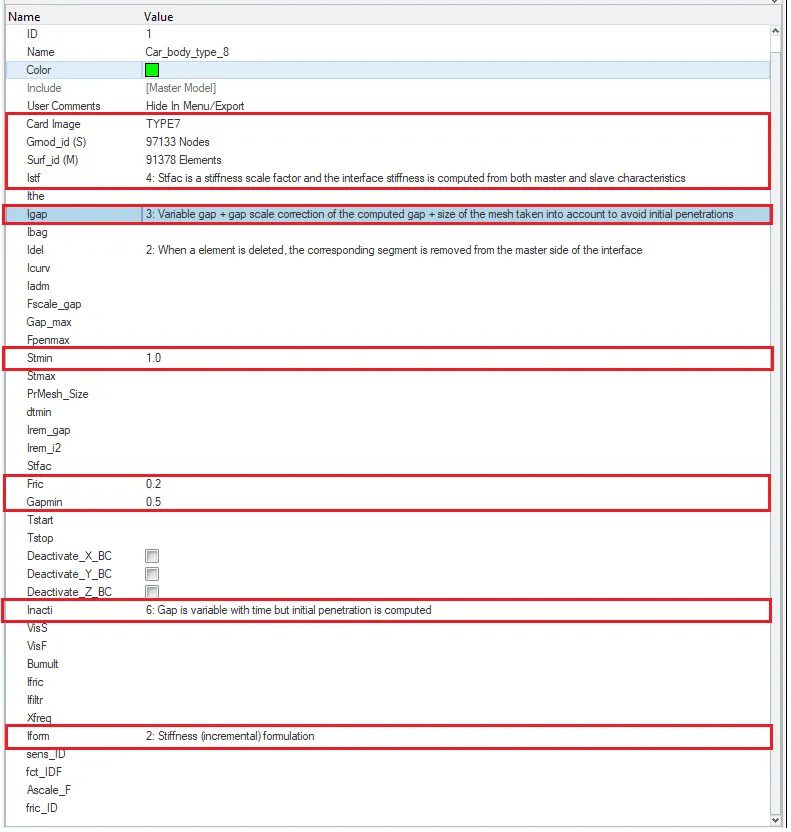
Image 3.2 Interface Card.
- After creating the interface the data of the interface is saved in the Time History File.
- To save the Interface Data Solver View>TH>Create>CONTACT>In the card Select the Interface.(Refer the image 3.3)
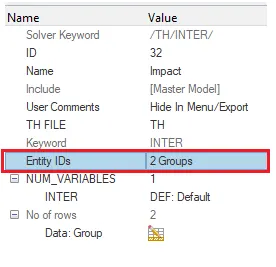
Image 3.3 Time History File for the Interface.
4. BOUNDARY CONDITION
- For this simulation due to the limitation of number of nodes most of the components are removed i.e the absence of wheel, suspension etc.
- To recreate the suspension and wheel the suspension connection in the car is fixed in Z direction.
- To fix the nodes at the suspension location first create the Rigids at that location.
- To create the Rigids 1-D> Rigids>Select the nodes at the suspension connection location>Create.(Refer the image 4.1)
- This procedure is repeated at other suspension location.
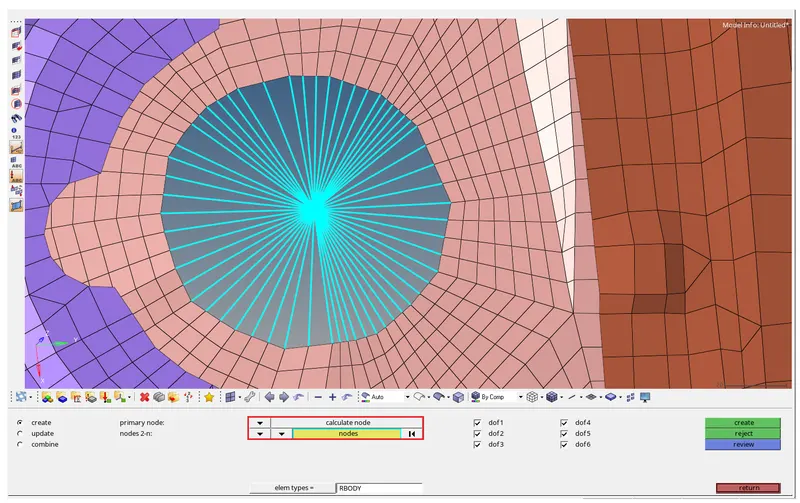
Image 4.1 Rigids at the Suspension Location
- Now to fix in Z-Direction Solver View>Create>BOUNDARY CONDIDTION>BCS(refer the image 4.1).
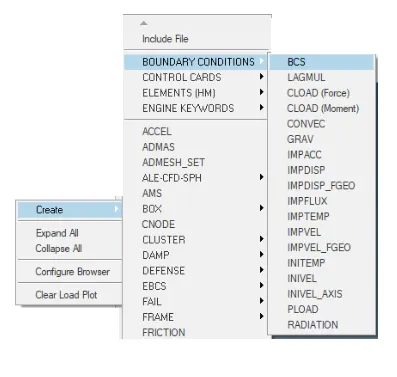
Image 4.2 Boundary Condition
- In the card BCS Select the master node at the centre of the suspension rigids>Tick DOF3(Refer the image 4.3).
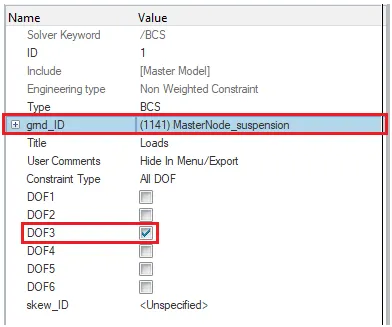
Image 4.3 BCS
5. IMPACTOR BOUNDARY CONDITION
- The node at the spring which is attached to the impactor is to be Fixed in all direction.
- To fix the Impactor spring node Solver view>Create>BOUNDARY CONDIDTION>BCS.
- In the BCS card Tick on all the DOFs and select the Impactor Spring node.(Refer the image 5.1)
Image 5.1 BCS on the spring node.
- After creating the Boundary condition a skew system is to be created.
- To create the Skew Solver View>Create>SKEW>MOV(Refer the image 5.2)
- In the Skew panel Select the origin node> Z direction> YZ plane.(Refer the image 5.3)
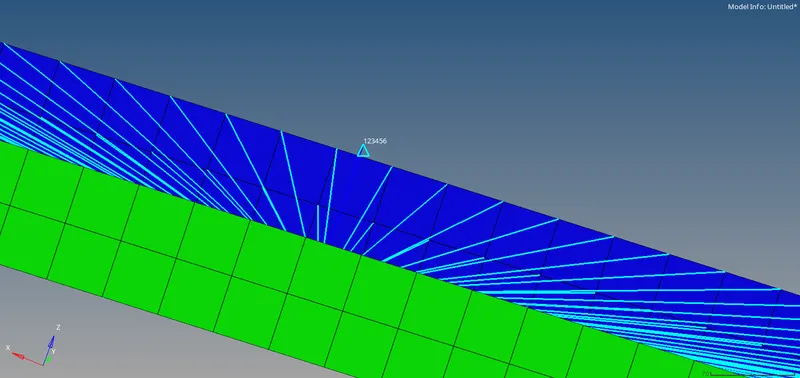
Image 5.2 Creating the Skew
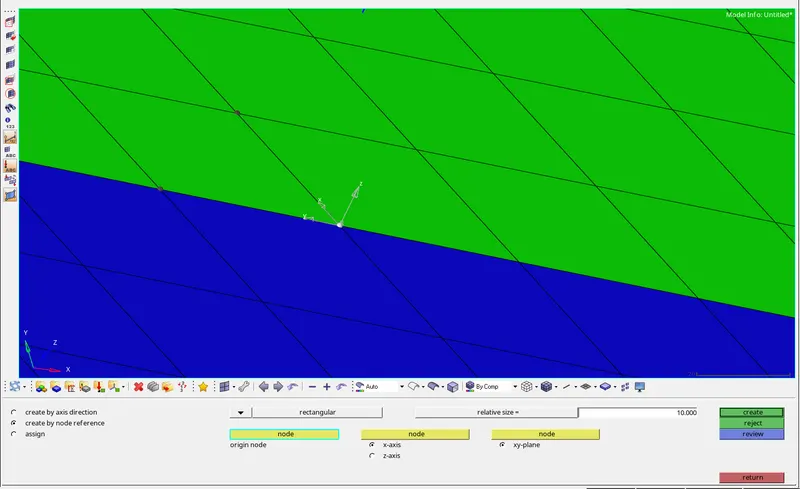
Image 5.3 Creating the Skew
- After creating the Skew the Master node is to fixed in all other direction except in Z direction with respect to the Skew created.
- To create the BCS Solver View>Create>BOUNDARY CONDIDTION>BCS.
- In the BCS card select the Master node of the rigids and tick all the DOFs except in Z direction.(Refer the image 5.4)
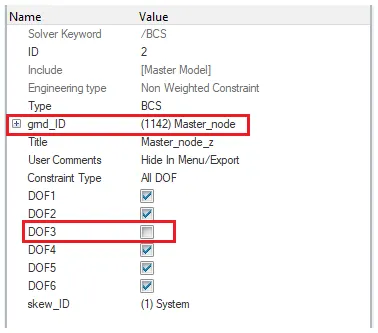
Image 5.4 BCS for Master node of the impactor.
6. IMPOSED DISPLACEMENT
- Displacement is to be imposed to the Impactor for certain duration of time to simulate the Roof Strength test.
- Displacement of the impactor is 0mm initially and 200mm at 200ms in the Z-direction of the Skew created.
- Therefore to impose the displacement a curve is to created.
- To create a curve Model view>Create>Curve and Right click on the Curve created>Edit.(refer the image 6.1)
- Now in the newly opened tab add the initial and final co-ordinates of the curve i.e 1(0,0) and 2(200,200) and Update.(refer the image 6.2)
- In Solver View Create>BOUNDARY CONDITION>IMPDISP(refer the image 6.3)
- In the IMPDISP card add the curve in fct_ID(T), select the skew system.(refer the image 6.4)
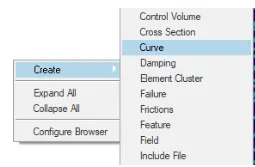
Image 6.1 Creating the curve
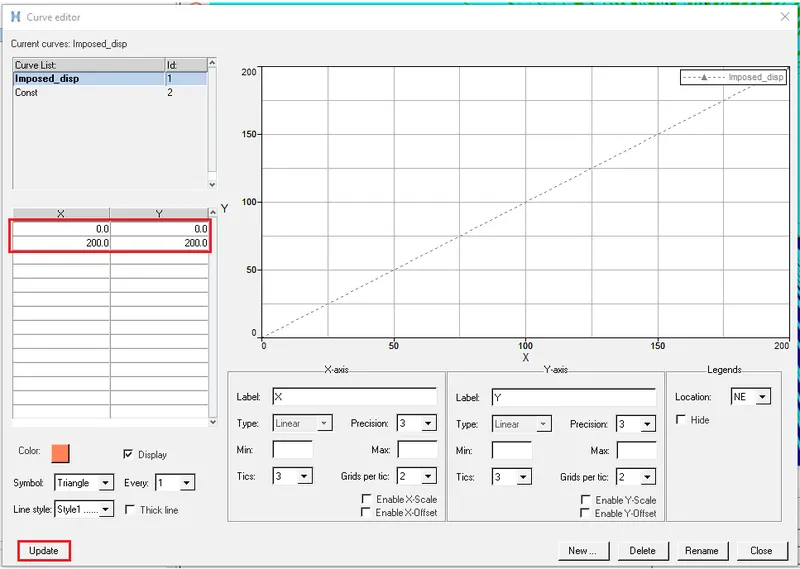
Image 6.2 Adding the co-ordinates.
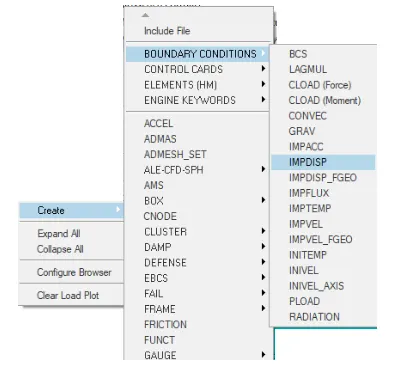
Image 6.3 Creating the Imposed Displacement.
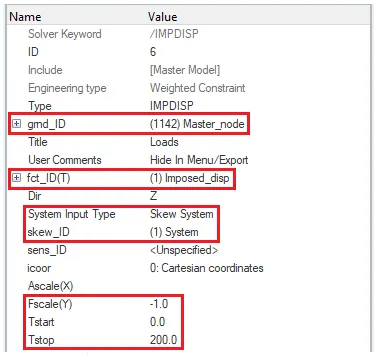
Image 6.4 Imposed Displacement Card.
7. CONTROL CARDS
- For this quasi static simulation many control cards are required.
- /ANALY card, /DEF_SHELL card, /DEF_SOLID card, /IOFLAG card, /SPMD card and /TITLE card are the cards required for the simulation.
- All these cards are created in the Solver view.
- To create these card Solver view>Create>CONTROL CARD>ANALY(refer the image 7.1)
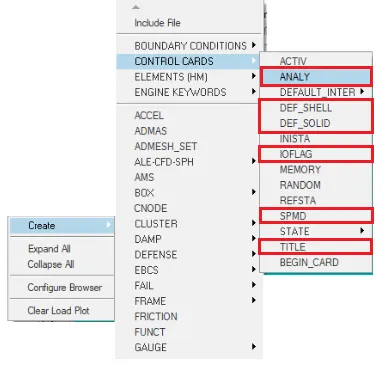
Image 7.1 Creating the Control cards.
- ANALY defines the type of analysis and sets analysis flags.
- SMPD card is for parallel program computation.
- TITLE card is for displaying the Title in the Plots.
- IOFLAG describes the input-output flags.
- DEF_SHELL card and DEF_SOLID is for setting the default values for the Shell element and solid types.
8. ENGINE FILE
- The run time for this simulation is 200ms.To set the run time to 200ms Solver View>Create>ENGINE KEYWORDS>RUN(refer the image 8.1)
- In the RUN card change the Tstop to 200.(refer the image 8.2)
- To print the results for every 0.0001 sec or 0.1ms Solver view>Create> ENGINE KEYWORDS>PRINT.(refer the image 8.3)
- In the Tfile card change the value of the Time frequency to 0.1.
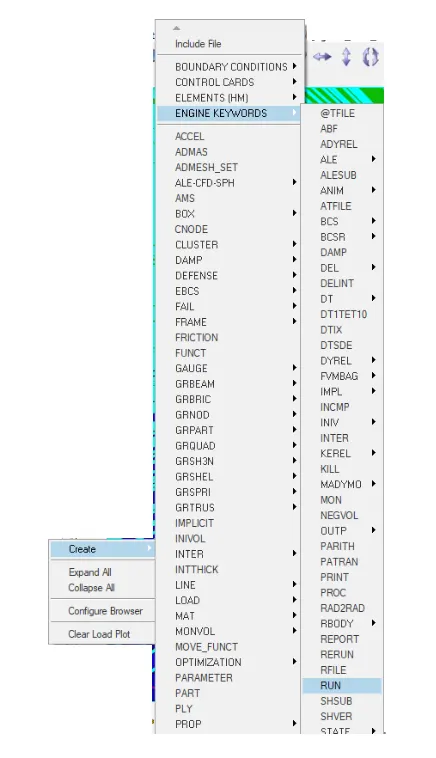
Image 8.1 RUN card.
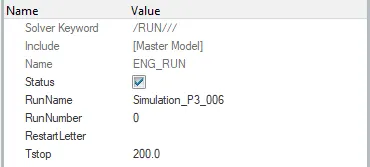
Image 8.2 Run time settings
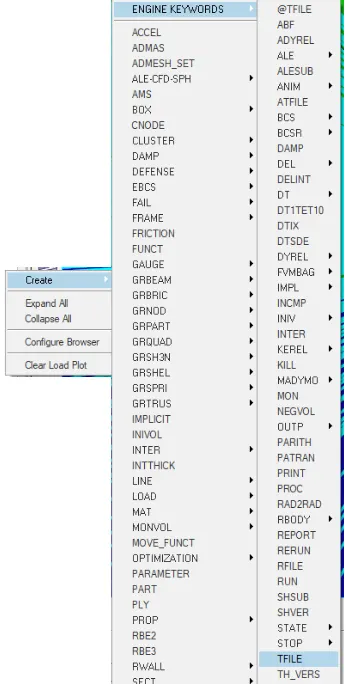
Image 8.3 TFILE Card
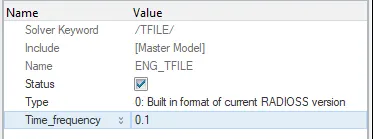
Image 8.4 Time frequency in TFILE card.
- To create animation file for every 0.005 sec in 200ms run time a total of 40 animation files are created.
- So to create 40 animation files the time frequency is 5.
- Therefore to create animation file Solver view>Create>ANIM>DT.(refer the image 8.5)
- In the ANIM/DT card change the value of the Tstop to 5.
- Also for this simulation the Constant time step is to be maintained to compute the solution faster.
- For maintaining the Constant time step DT, DT/NODA and DT/SHELL card is to be created.
- To create those cards Solver view>Create>ENGINE KEYWORDS>DT>DT(refer the image 8.6)
- In the DT card change the value of the Tscale to 0.9 and Tmin to 0.0005.
- In the DT/NODA Tscale value is 0.67 and Tmin is 0.0005 and in DT/SHELL Tscale is 0.9 and Tmin is 0.0005.
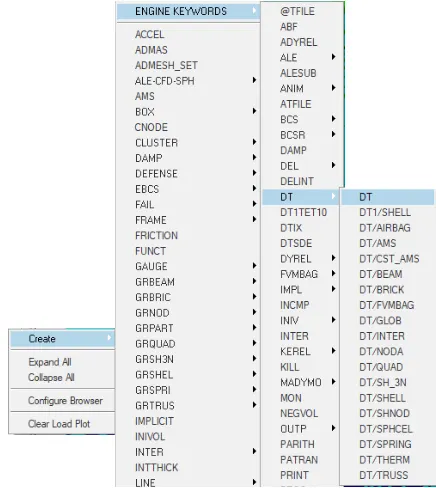
Image 8.5 Creating the DT card.
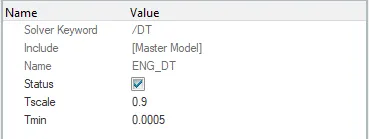
Image 8.6 DT card.
9. OUTPUT REQUEST IN THE ANIMATION FILES
- Some output are to be shown in the animation. They are Elemental energy, Elemental equivalent plastic strain, Elemental hourglass energy, Elemental von Mises stress and Nodal added mass.
- Also Parallel arithmetic should be turned on.
- To request the output in the animation Solver View>Create>ENGINE KEYWORDS>ANIM>ELEM.(refer the image 9.1)
- In the ANIM/ELEM card tick the EPSP, ENERGY,HOURG and VONM.(refer the image 9.2)
- Similarly create the ANIM/NODA for nodal added mass.
- In the ANIM/NODA card tick on the DMAS.(refer the image 9.3)
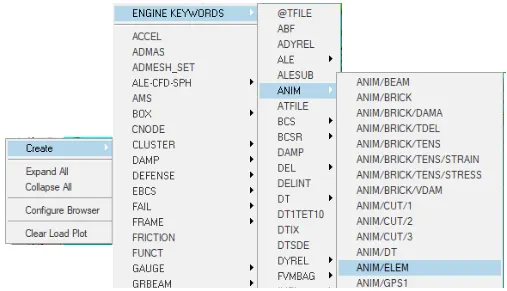
Image 9.1 Creating the ANIM/SHELL card
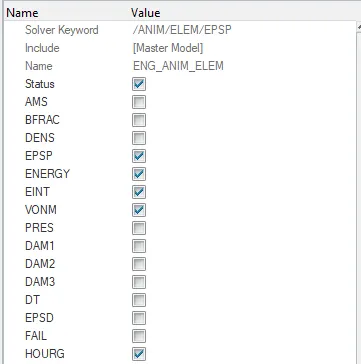
Image 9.2 ANIM/ELEM card.
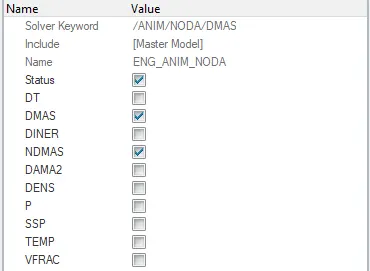
Image 9.3 ANIM/NODA card.
10. OUTPUT REQUEST
- In this simulation force vs displacement graph is to be plotted.
- To plot the graph of nodal displacement a TH file is to be created. To create TH file Solver view>Create>TH>NODE(refer the image 10.1).
- And for Force vs time graph Solver view>Create>TH>INTER(refer the image 10.2).
- In the TH/NODE card select the node in Entiy IDs and select the Skew system.(refer the image 10.3)
- And in the TH/INTER card select the contact between the Impactor and the car.(refer the image 10.4)
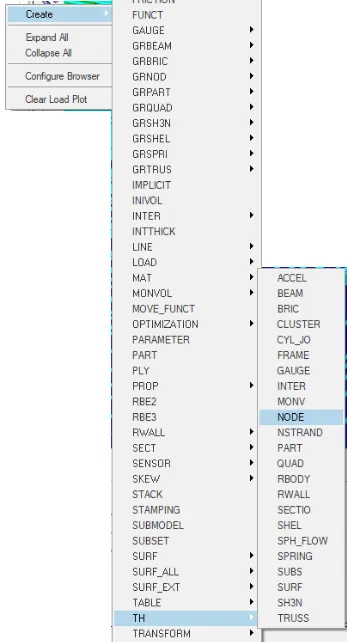
Image 10.1 Creating the TH/NODE Card
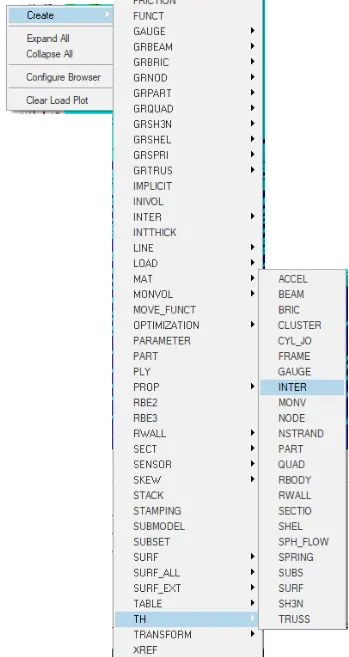
Image 10.2 Creating the TH/INTER Card
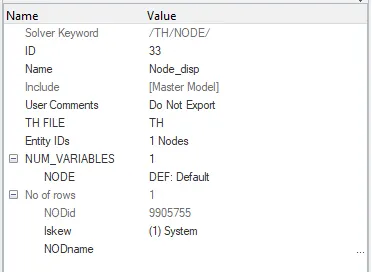
Image 10.3 TH/NODE Card
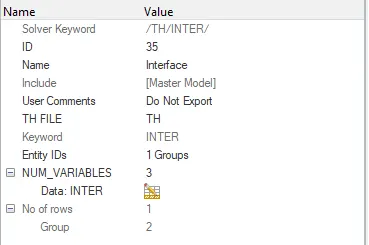
Image 10.4 TH/INTER Card
RESULTS:
- The simulation ran with Normal Termination and took nearly 14hrs.(refer the image R.1)
- And in the result the Energy error was found to be -5.0% and Mass error was 0.2153E-03kg.
- Both the Energy error and Mass error were within the acceptable range.
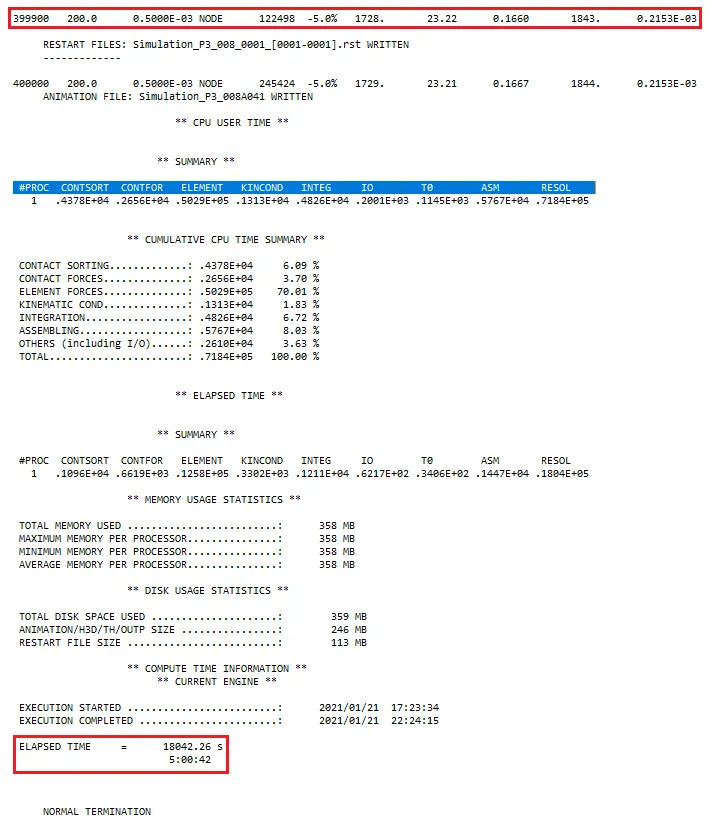
Image R.1 Output
- Result is viewed in the Hyperview and Animation R.1 shows the animation of the Roof Strength Test.
- Using the Counter plot Von Mises stress induced during the simulation is viewed.
- Animation R.2 shows the Von Mises stress induced in the BIW.
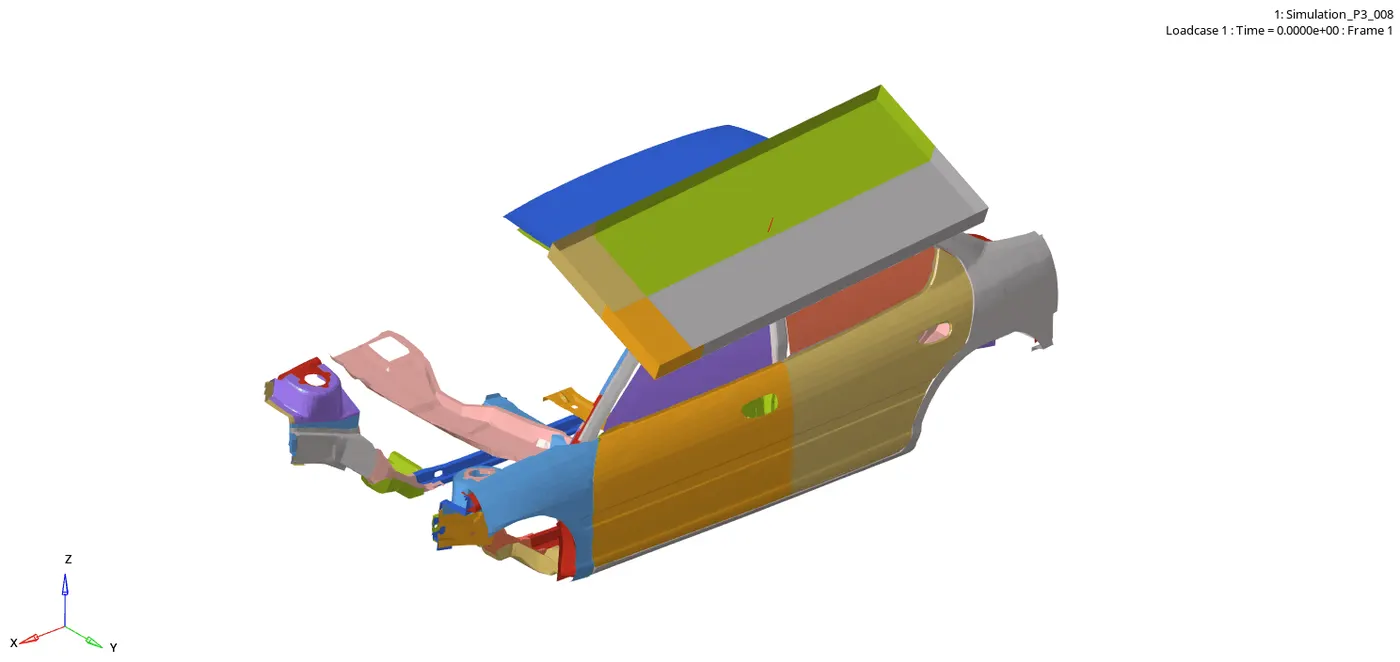
Animation R.1 Simulation of Roof Strength Test.
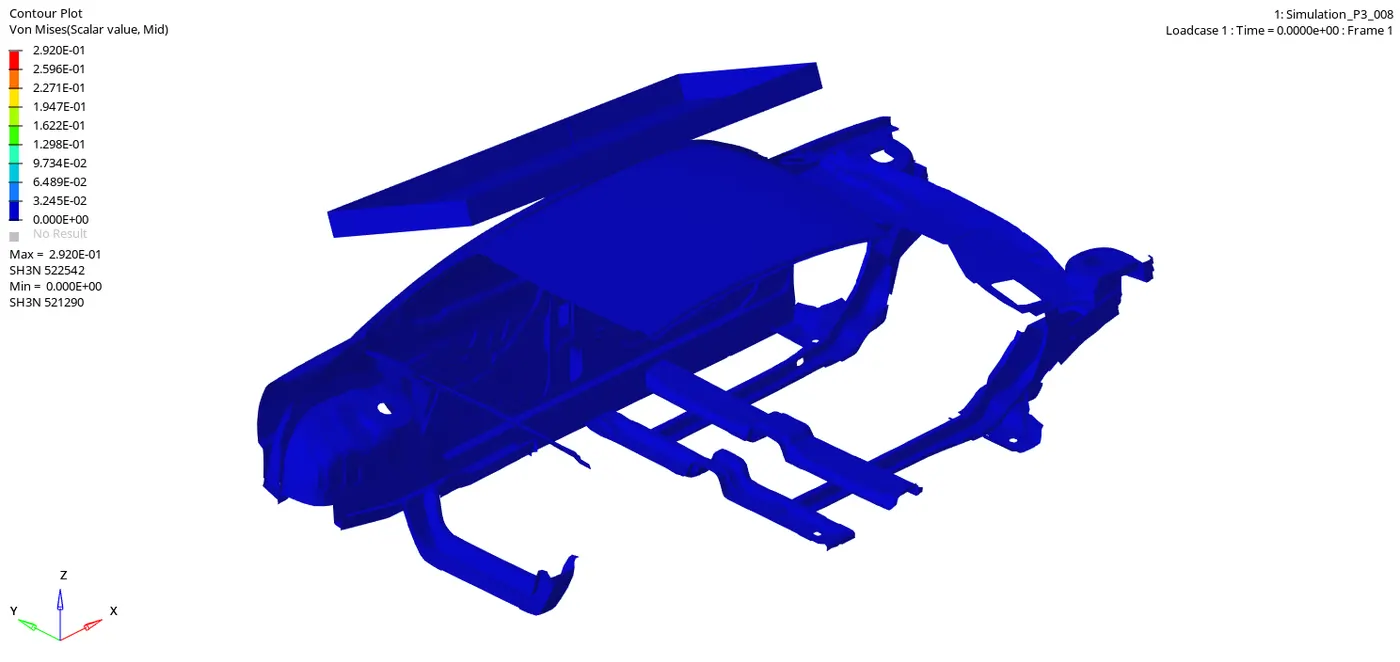
Animation R.2 Von Mises Stress induced during the test.
GRAPH
1. GRAPH OF ENERGIRES VS TIME
- Graph of energies such as Internal Energy, Kinetic energy, Total energy, Hourglass Energy and Contact Energy vs Time is plotted in the Hypergraph.
- To plot the graph the Time history file is uploaded in the Hyprgraph.
- To plot the Energy vs Time graph Build Plots>X-Type - Time>Y - Global Variables> Y - Request - Internal Energy, Kinetic Energy, Total Energy, Hourglass Energy and Contact Energy>Y - Component - MAG>Apply.(refer the image 1.2)
- Graph G.1 shows the Graph of the energies vs time.

Image 1.1 Build Plots
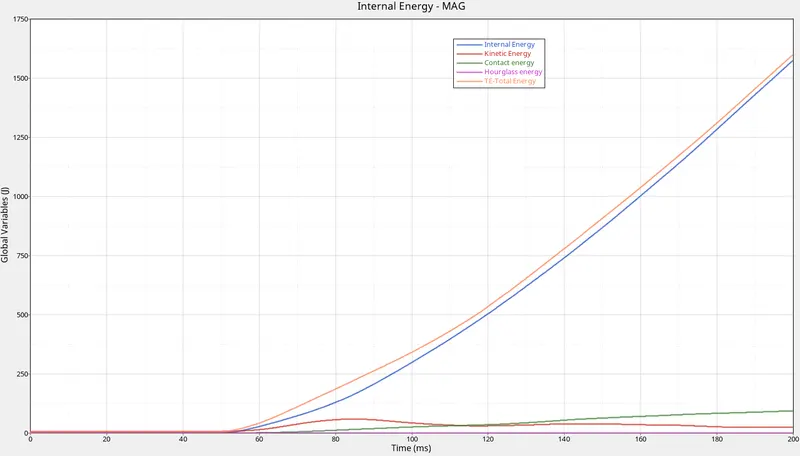
Graph G.1 Graph of Energies vs Time.
- There is no increase in the energies until the Impactor touches the car BIW.
- Both internal energy and total energy rises simultaneously as there is more deformation on the roof and the car is stationary.
- Also the the Kinetic energy is minimum as there is slight movement in the downward direction.
- The energy loss due to contact was found to be 9.412576e+01 J.
- The Hourglass energy in this simulation is 0 J i.e there is no error due to Hourglass.
| Energy | Maximum Value |
| Total Energy | 1.599291e+03 J |
| Internal Energy | 1.575135e+03 J |
| Kinetic Energy | 5.928247e+01 J |
| Contact Energy | 9.412576e+01 J |
2. GRAPH OF DISPLACEMENT VS FORCE.
- To plot the Displacement of the Impactor vs Force Graph displacement of the impactor is shown as elongation of the spring connected to the Impactor or the Displacement in Z-Axis according to the Skew created on the impactor.
- For this graph Elongation of the spring is taken as the displacement of the impactor.
- To plot the graph Build Plots> X- Type - Spring/FMVSS Impactor>X- Component- TL-Total Elongation> Y -Interface/Contact Forcs> Y - Request -1 Type_7>Y - Component - NF-Resultant Normal Force, TF-Resulatant Tangential Force and TF_ Resultant Force>Apply.(refer the image 2.1)
- Graph G.2 shows the graph of the Displacement vs Force.

Image 2.1 Build Plots.
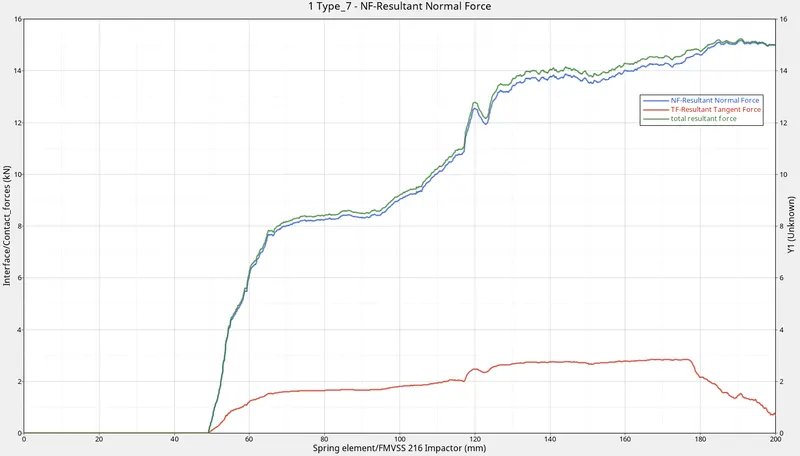
Graph G.2 Displacement Vs Force Graph.
- In the graph there no is force on the BIW until the Impactor hits the roof and the force increase suddenly till 7.769410e+00 kN.
- And after that point it increases gradually and reaches the maximum value of 1.523946e+01 kN.
- The maximum force applied on the car BIW roof was 1.523946e+01 kN.
CONCLUSION: The Roof Strength Test is conducted virtually on the given BIW of a Car.
The Graph of Energy vs Time and Displacement vs Force are plotted using the Time History file requested in the Simulation.
The maximum force applied on the car BIW is 1.523946e+01 kN during the simulation.