Project - Position control of mass spring damper system
Aim:
To obtain the transfer function of a mass spring damper system and use it in the model and to Add a PID controller to adjust the force on mass so that its position follows a reference signal.
THEORY:
SPRING MASS DAMPER SYSTEM:
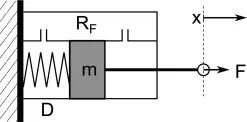
according to Newton’s second law (F = m*a)
F = Resultant of all the forces
m = Mass
a = Acceleration
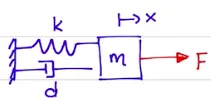
where
k= is the spring stiffness
d= is the damping coefficient
The above system is in a state of rest. Let's consider a moving Mass Spring Damper System to see forces act during motion. What are the forces acting if the system is moving?
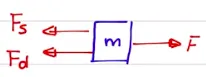
Expression for Spring Force and Damping Force-
(spring force)Fs = k*x ----(1)
(Damping force)Fd = d*(dx/dt) ----(2)
we know the transfer function of mass spring damper system
f(t)-cdx/dt-kx(t)=mdx^2/dt^2
Byapplying laplace transform
F(s)-csX(s)-kX(s)=ms^2X(s)
T(s)=1/ ms^2+Cs+k %transfer function
A MATLAB code has been created in the workspace to build the model in the simulink:
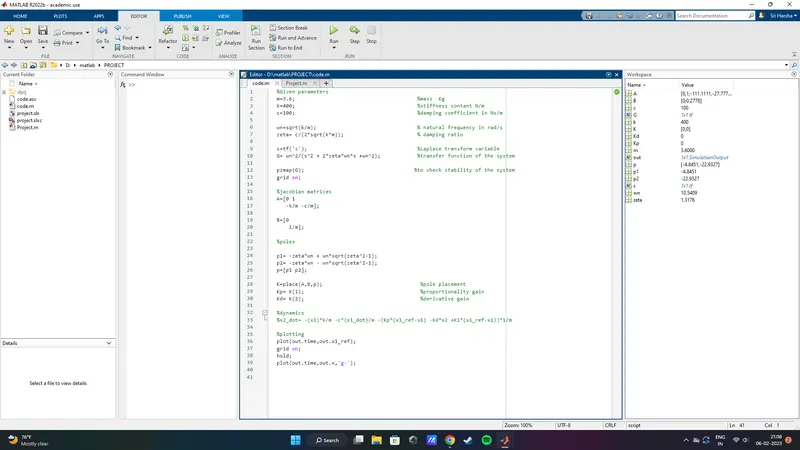
we found the values of Kp and Kd to be 0 and that zeta is 1.316 which is an overdamped situation, we may have to tune the values of Ki to acheive our PID design to get the required result.
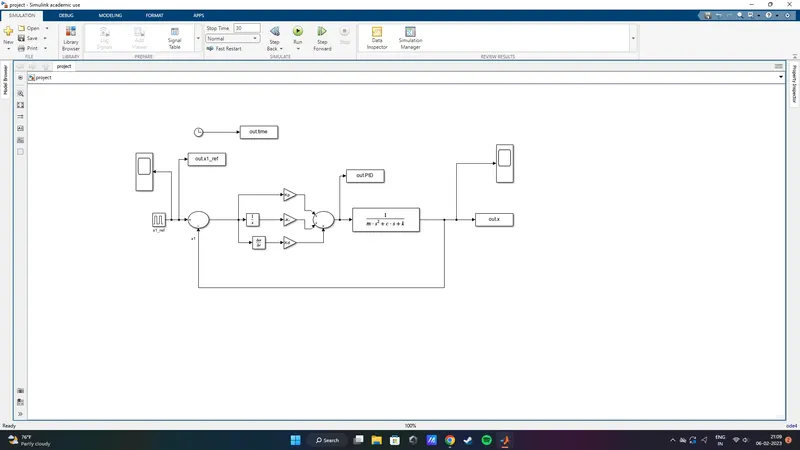
A SIMULINK model was created using these variables to verify the simulation which can be seen below:
BLOCKS USED:
Pulse generator, integrator, derivative, gain,sum,trasnfer function,clock, to workspace, scope
All the blocks used are connected as shown in the figure above.
WORKING:
An input reference is given as a pulse generator with amplitude 1, period of 10 s and pulse width of 50% is set to acheive the same input as seen in the question, then from the reference input the out put displacement is subtracted which gives us the error signal which is fed into the PID controller or Kp,Kd and Ki blocks as seen in the figure, the summ of all the blocks gives us a controlled value which is given as an input to the transfer function.
here we have got the values
Kp= 0
Kd=0
and Ki=0 (which is manually tuned)
we can verify for various values of Ki until we get desired output
Figure 1
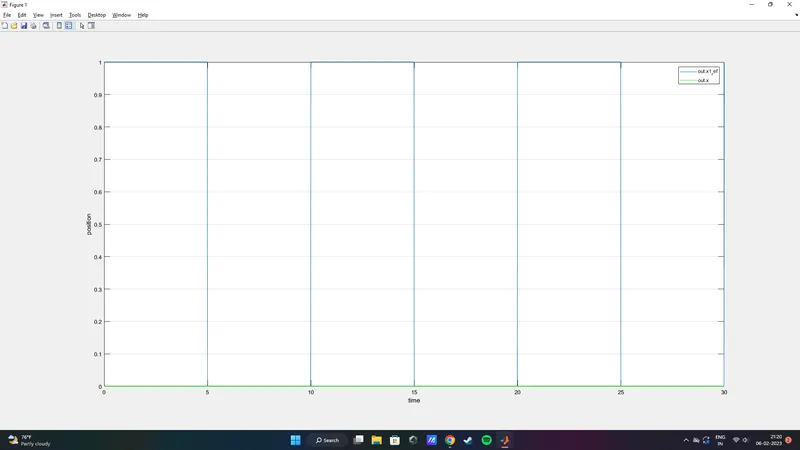
When the value of Ki is also set to 0 we can see that the output is nowhere near the input ref which we gave hence we use a much high value of Ki and verify
FIGURE 2
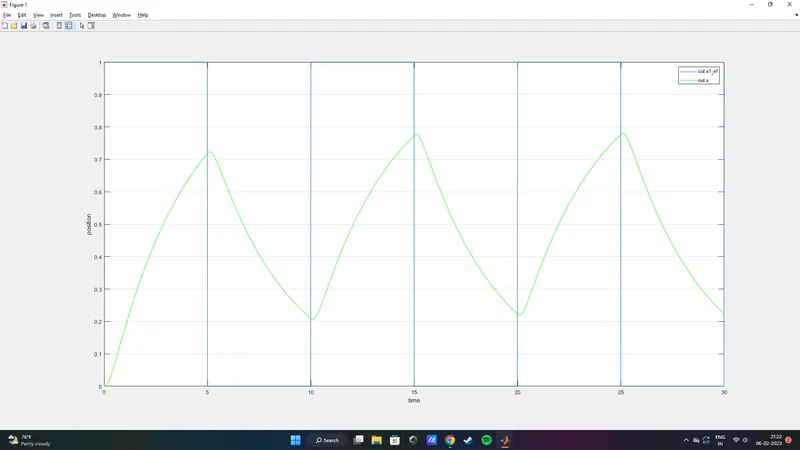
when the value of Ki is given 100 units we can see a change in the input graph which is still not similar to ref input given so we tune for a even more higher value
FIGURE 3
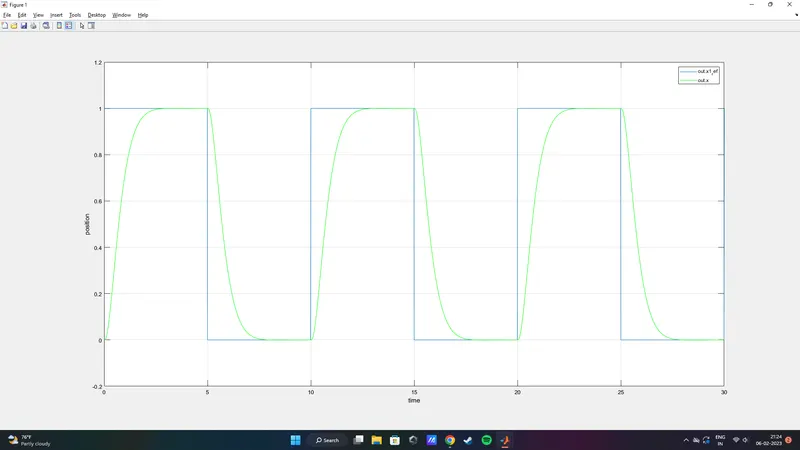
For a value of Ki =500 we can see the output is omewhat looking like the input ref which we have provided from here we can increase gradually the value of Ki until we are satisfied with the graph
FIGURE 4
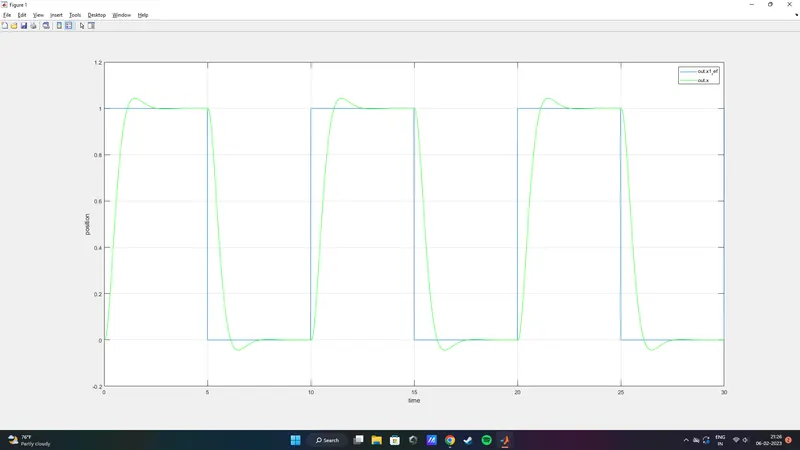
when the value of Ki is choosen to be 800 the output almost looks similar we can try for one last value of Ki to be 1000 to verify.
FIGURE 5
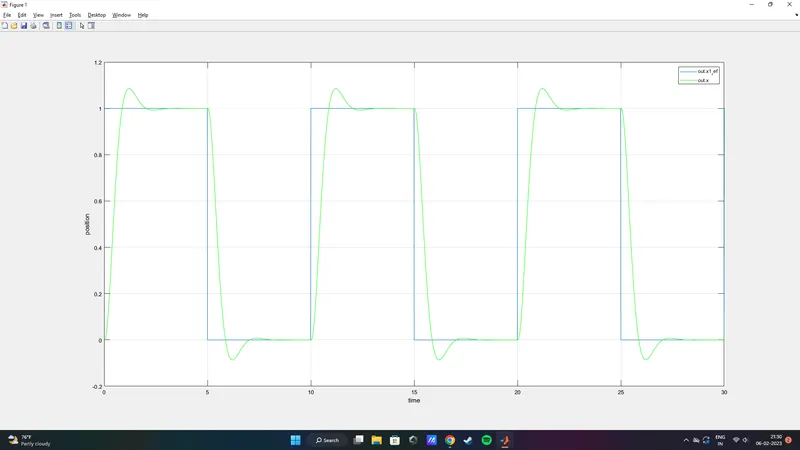
The Ki is set to 1000 and we can clearly see that the output we get is almost matching the input ref after the value of Ki=1000 greater than that we have same result in graph but the peaks tend to increase which is not good for the system.
CONCLUSION:
Obtained the transfer function of a mass spring damper system with m = 3.6kg; k = 400 N/m; c = 100 Ns/m using matlab programming and Created a transferfunction model and added PID controller and adjusted the force on mass so its position follows a reference signal when
Kp=0
Ki=1000
and Kd=0