Project - Data Handling and Interpolation
project :
code
v=[-17.3 -17.1 -17 -16.8 -16.5];
i=[-28 -24 -19 -14 -9];
xq= -17.3:0.1:0.9;
yq= interp1(v,i,xq);
plot(v,i,'m--',xq,yq,'r*')
output :
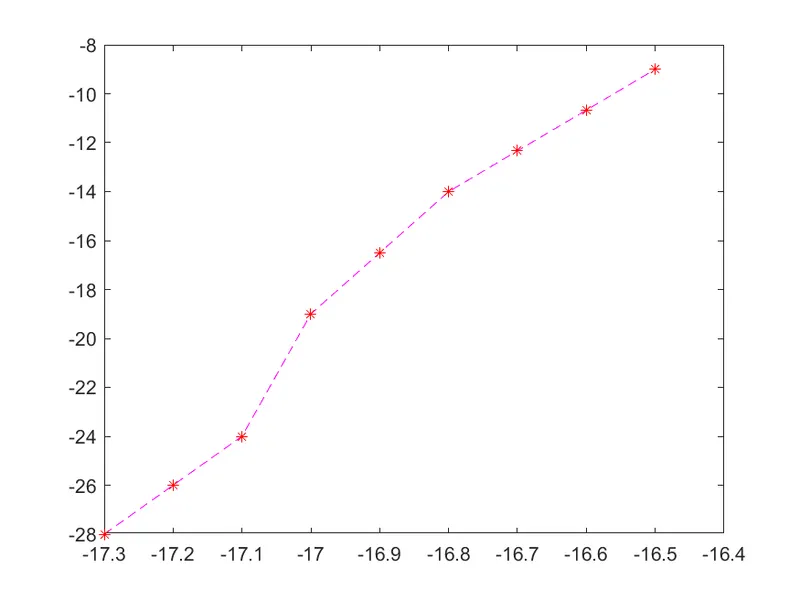
INTERPOLACTION OF DATA:
% to find the current values
%(we denote currnet is VV )
v=[-17.3 -17.1 -17 -16.8 -16.5 -16 -15-14 -12 -10 -8 -5 -2 -0.20 .090 .190 .270 .390 .430 .50 .550 .60 .620 .65];
i=[-28 -24 -19 -14 -9 -6 -4 -3 -2 -1.3 -1 -0.6 -0.3 -0.1 0 0 0 0.01 0.03 0.17 0.42 1.23 1.99 3.91];
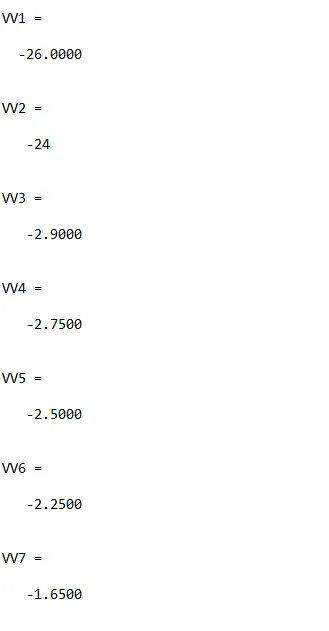
VV1=interp1(v,i,-17.2)
VV2=interp1(v,i,-17.1)
VV3=interp1(v,i,-13.8)
VV4=interp1(v,i,-13.5)
VV5=interp1(v,i,-13.0)
VV6=interp1(v,i,-12.5)
VV7=interp1(v,i,-11)
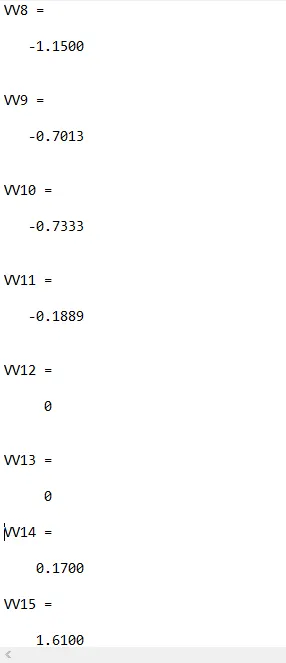
VV8=interp1(v,i,-9)
VV9=interp1(v,i,-5.76)
VV10=interp1(v,i,-6)
VV11=interp1(v,i,-1)
VV12=interp1(v,i,0.11)
VV13=interp1(v,i,0.25)
VV14=interp1(v,i,0.5)
VV15=interp1(v,i,0.61)
output of data :
read excel file :-
code :
num = xlsread('C:\Users\HP\Desktop\mat/VI.xlsx')
%use the command to read the excel file