Project - Data Handling and Interpolation
In a laboratory experiment, data of voltage and current has been recorded and the same is attached in an excel file. Read the excel file in the Matlab program and perform the interpolation in the range of -17.3:0.1:0.9. Generate the interactive plot for the interpolated data and store them in a text file.
Key Highlights:
- Graphical solutions are more visual and appealing
- Interpolation of data
- Read excel file
- Write to text file
Deliverables:
- Find missing data and save it in text
- Interpolate the data set
- Save your program and attach the same.
- Save txt file and upload in attachment
MATLAB CODE:
clear all
clc
close all

A = readmatrix('VI.xlsx');
V = A(:,1);
I = A(:,2);
X = [-17.3:0.1:0.9];
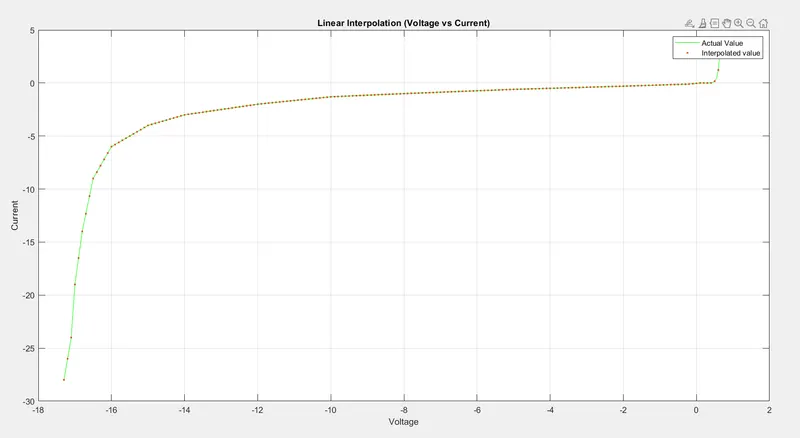
Z1 = interp1(V,I,X);

figure(1);
plot(V,I,'g',X,Z1,'.');
grid;
xlabel('Voltage'); ylabel('Current');
title('Linear Interpolation (Voltage vs Current)');
legend('Actual Value', 'Interpolated value');

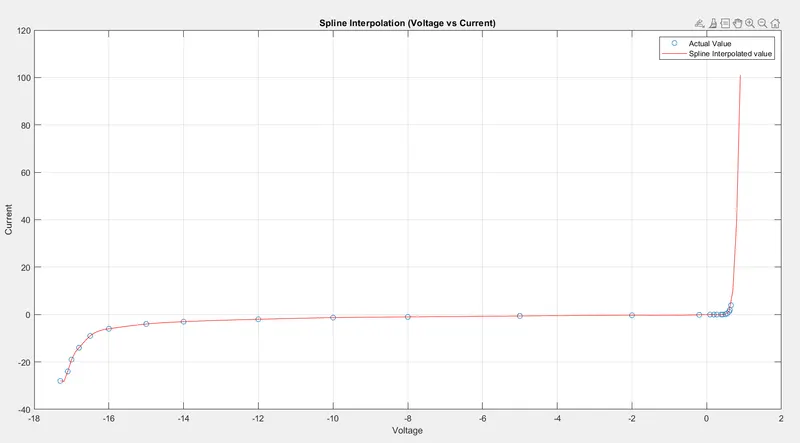
Z2 = interp1(V,I,X,'spline');
figure(2);
plot(V,I,'o',X,Z2,'r');
grid;
xlabel('Voltage'); ylabel('Current');
title('Spline Interpolation (Voltage vs Current)');
legend('Actual Value', 'Spline Interpolated value');

fileid=fopen('VI.txt','w');
fprintf(fileid,' Voltage  Current\n');
fprintf(fileid,'%4f  %4f\n',X,Z2);
savefig(1,'VI linear');
savefig(2,'VI spline');
fclose(fileid);
OUTPUT: