Project - Data Handling and Interpolation
1.
[data1] = xlsread("VI (7).xlsx","A2:B25");
V = data1(:,1);
I = data1(:,2);
R = -17.3:0.1:0.9; % query points
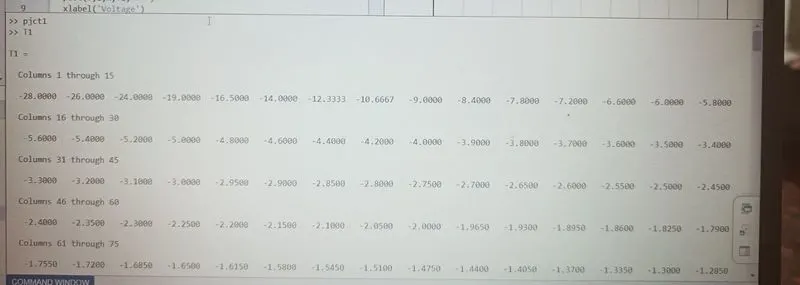
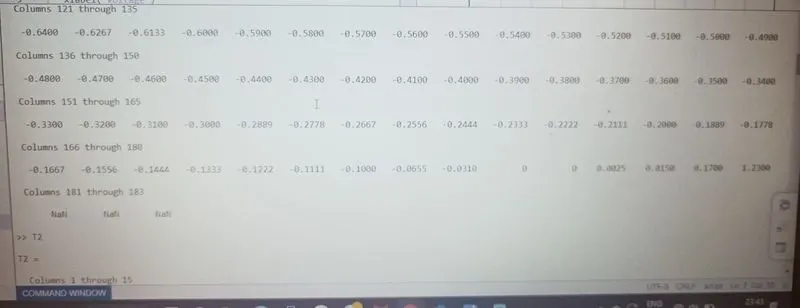
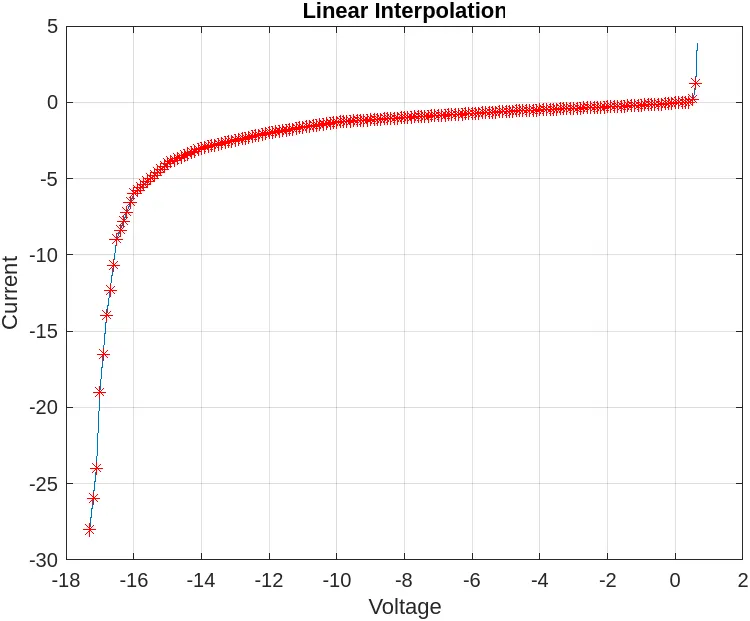
T1 = interp1(V,I,R); % Linear Interpolation
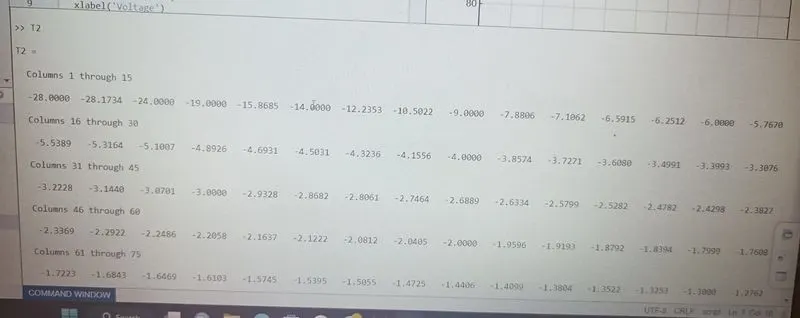
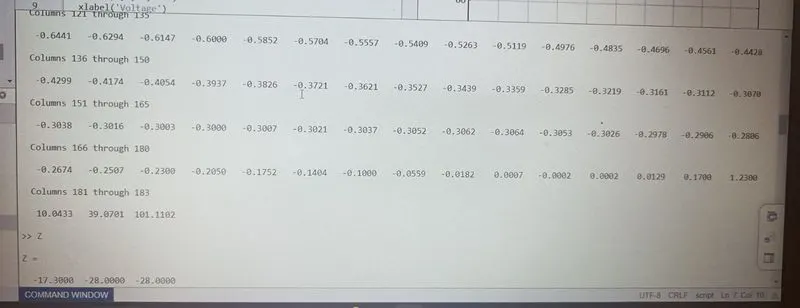
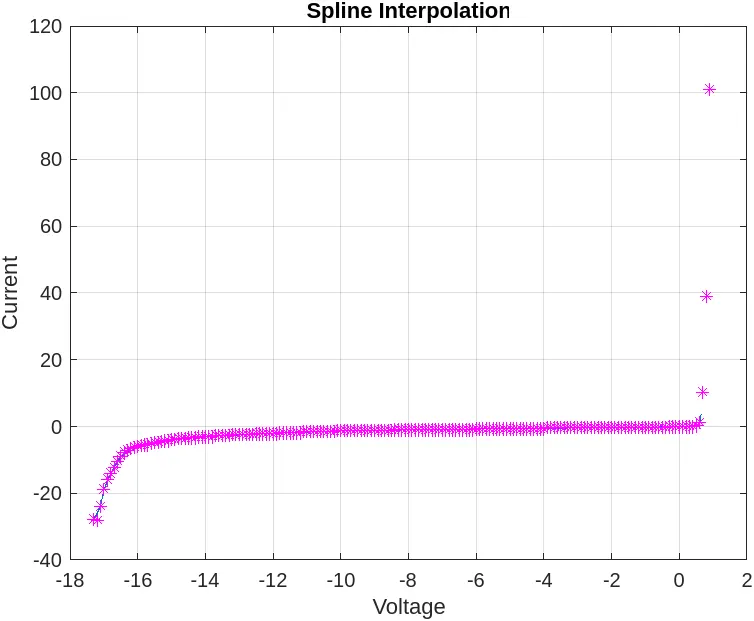
T2 = interp1(V,I,R,'spline'); % spline interpolation
figure(1)
plot(V,I,R,T1,'r*')
xlabel('Voltage')
ylabel('Current')
title('Linear Interpolation')
grid on
figure(2)
plot(V,I,R,T2,'m*')
xlabel('Voltage')
ylabel('Current')
title('Spline Interpolation')
grid on
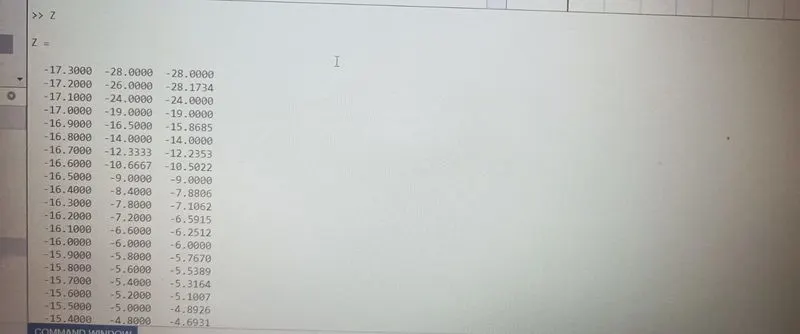
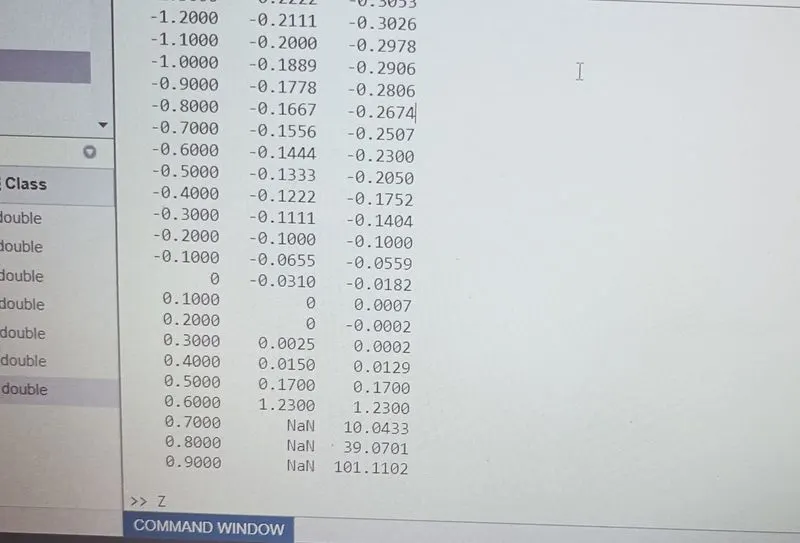
Z=[R' T1' T2'];
save interpolationData.mat Z