Project - Data Handling and Interpolation
OBJECTIVE:
To generate the interactive plot for the interpolated data and store them in a text filefor the given VI.xlsx file.
File name: Project.m
Output txt file: Proj.txt
% V vs I
A=xlsread('VI.xlsx'); %read the excel file
%A(row,col)
V=A(:,1); % COLUMN for VOLTAGE
I=A(:,2); % COLUMN for CURRENT
V1=-17.3:0.1:0.9; %interpolation range
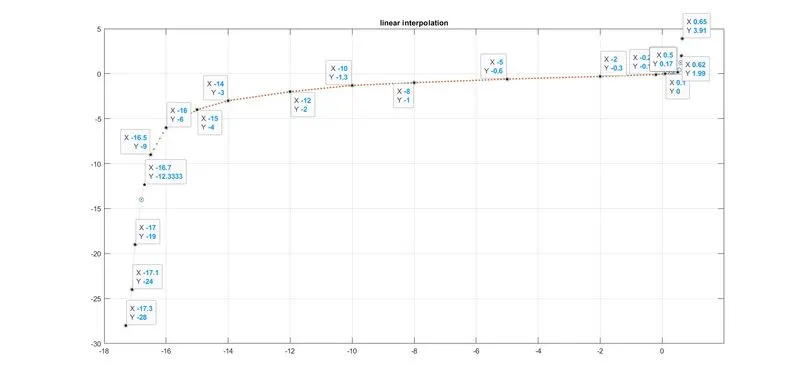
In1=interp1(V,I,V1); %linear interpolation
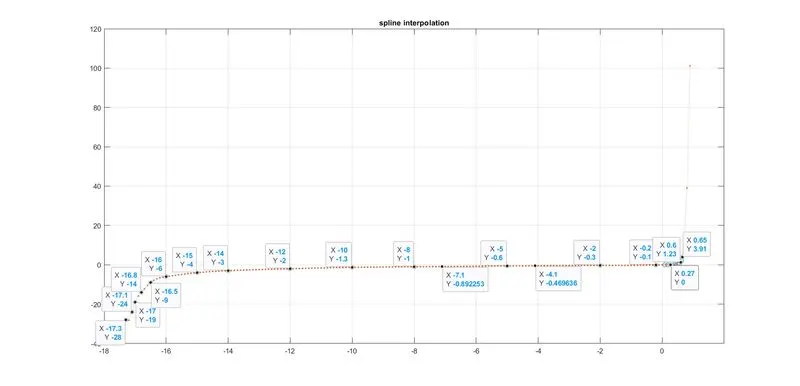
In2=interp1(V,I,V1,'spline'); %spline interpolation
figure(1)
plot(V,I,'o',V1,In1,':.') % plot linear interpolation
grid
title('linear interpolation')
figure(2)
plot(V,I,'o',V1,In2,':.') % plot spline interpolation
grid
title('spline interpolation')
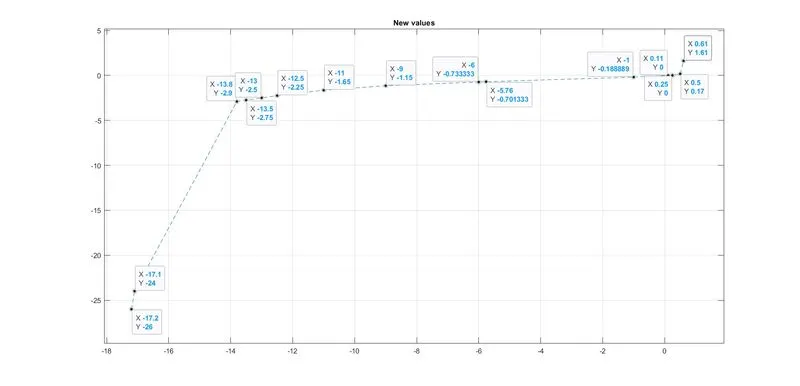
Vn =[-17.2 -17.1 -13.8 -13.5 -13.0 -12.5 -11 -9 -5.76 -6 -1 0.11 0.25 0.5 0.61]; % new missing voltage range
I2=interp1(V,I,Vn); %linear interpolation for find value of current
figure(3)
plot(Vn,I2,'o--') % plot linear interpolation for new voltage and current value
grid
title('New values')
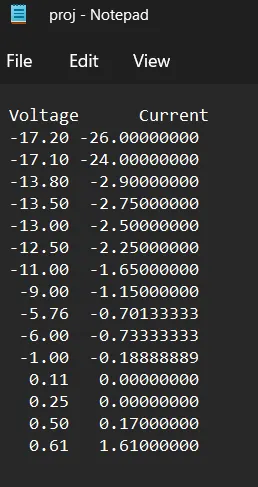
VI2=[Vn;I2]; % save value in matrix
fid=fopen('proj.txt','w'); % openning a text file named as 'proj' with to write data
fprintf(fid,'%6s %12s\n','Voltage','Current'); % column name for voltage and current
fprintf(fid,'%6.2f %12.8f\n',VI2); % saving data for voltage and current in the text file
fclose(fid); % closing text file
RESULT:
>> Project
LINEAR INTERPOLATION:
Spline interpolation
New Values of voltage and current