Project - Data Handling and Interpolation
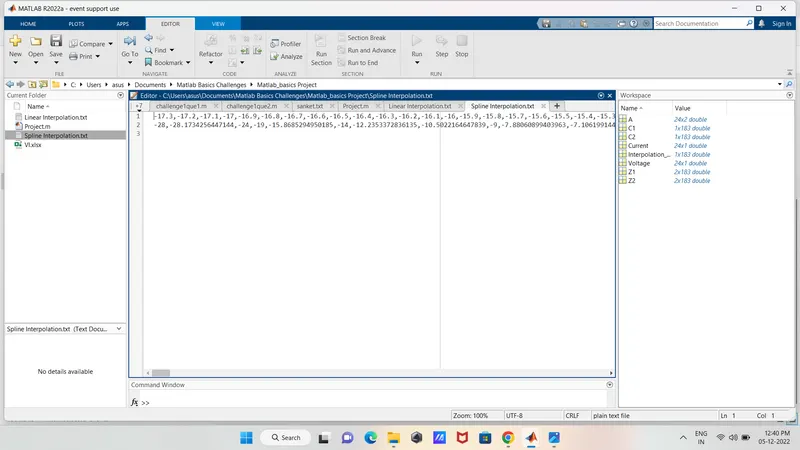
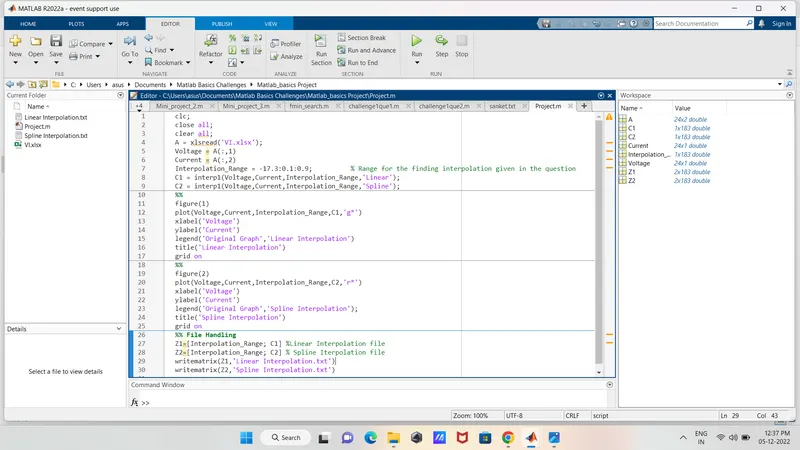
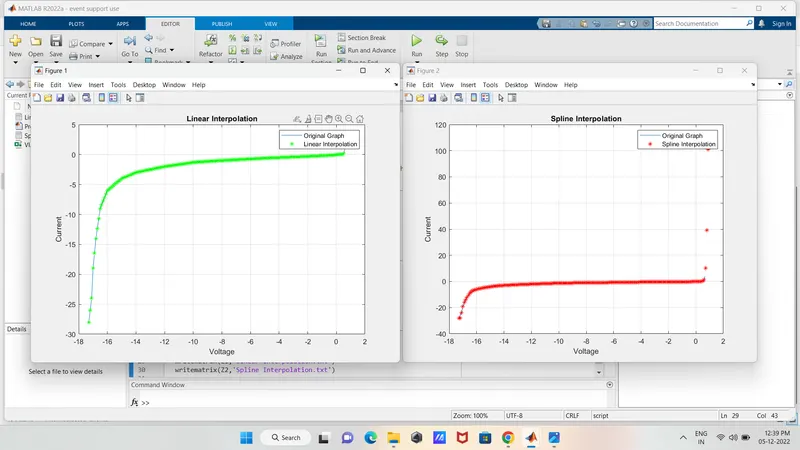
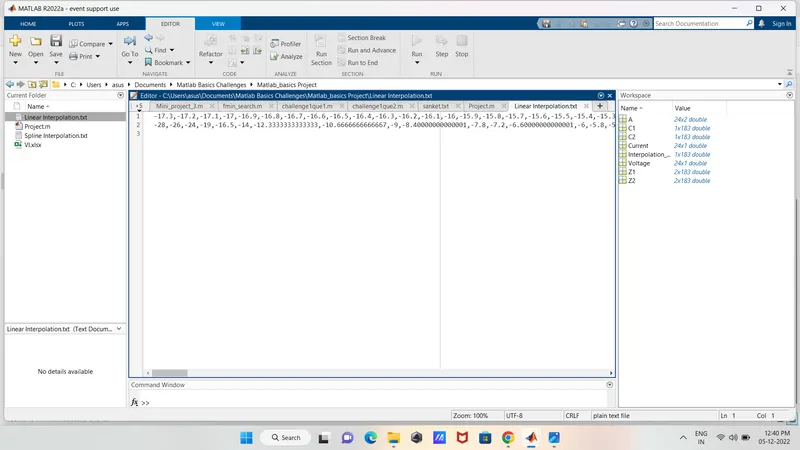
1.In a laboratory experiment, data of voltage and current has been recorded and the same is attached in an excel file ( Click on this link VI.xlsx ). Read the excel file in the Matlab program and perform the interpolation in the range of -17.3:0.1:0.9. Generate the interactive plot for the interpolated data and store them in a text file.
(Plot for the Linear as well as spline Interpolation)
(Linear Interpolation .txt file)
(Spline Interpolation .txt file)