Project - Data Handling and Interpolation
AIM: Read the given experiment excel file data in the matlab program and perform the interpolation. Also, find the missing data and write it to the text file.
OBJECTIVE: Interpolate the given data in the range, -17.3 : 0.1 : 0.9 and plot the V-I characteristics.
THEORY:
1. Use the xlsread function in the editor to read the given data into the matlab workspace.
2. The xlsread function contains the, filename, sheet and the row & column address to copy the data into the matlab workspace. It is as shown in figure below.
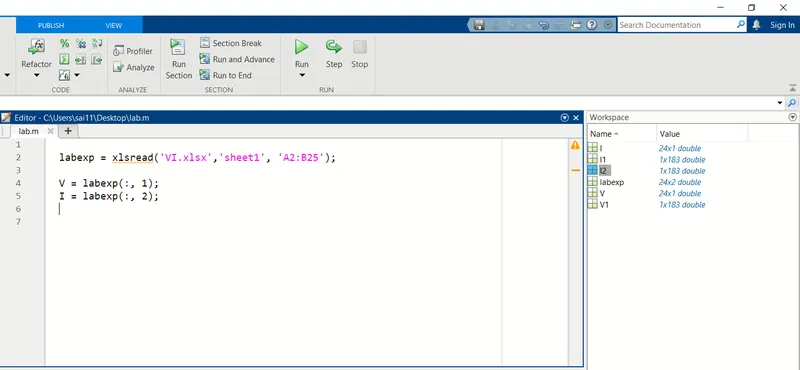
3. The resultant data of V and I is stored as the vector form in the matlab workspace.
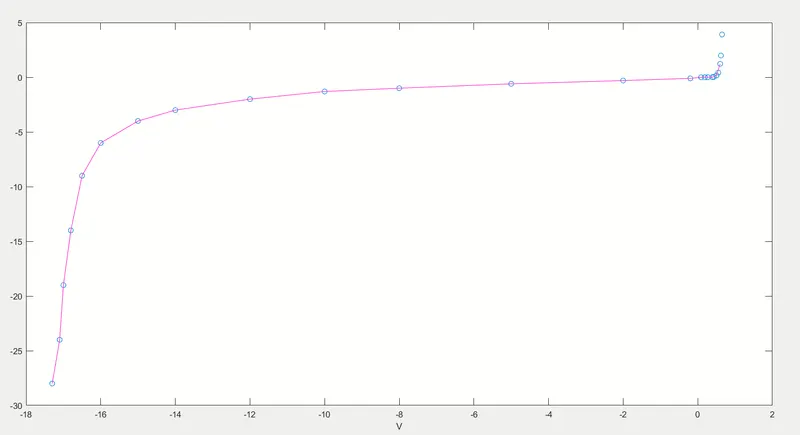
4. After loading the data in the workspace, plot the V-I characteristics of the given data using the plot command in the command window. The resultant diagram is as shown below.
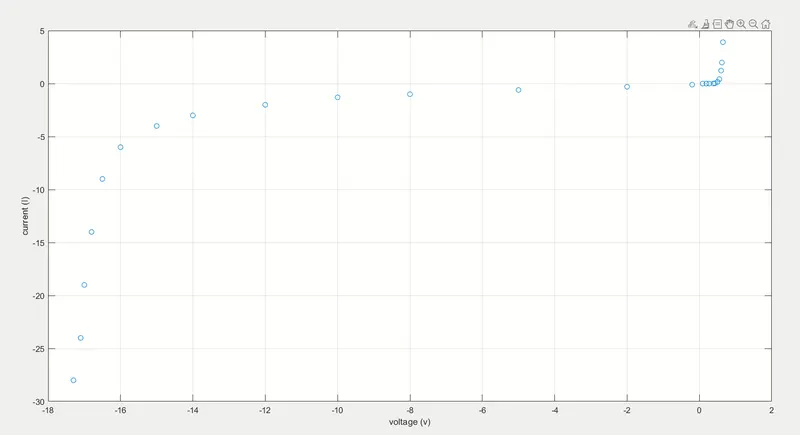
5. From the curve, we can say that the V-I characteristics of the lab experiment are of diode. Also from the given data, we can observe the barrier voltage (Forward voltage) of the diode is 0.65 to 0.9V. So, we can identify it as the Silicon junction diode.
6. A diode is a two terminal (mainly p & n) electronic component which conducts electricity in one direction and each diode has its own breakdown voltage to start conducting in the forward bias.
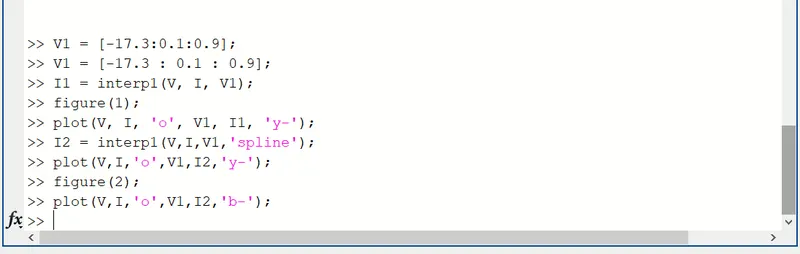
7. Now, interpolate the data in the given range of -17.3:0.1:0.9 and store the same in other name using the interp1 command.
8. Now, plot the characteristics between the previous data and the interpolated data. The figure can be shown as below.
Command window
Linear interpolation
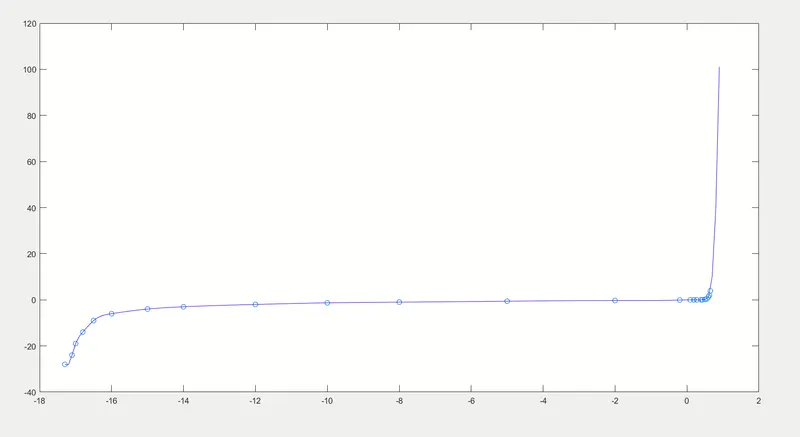
Spline interpolation
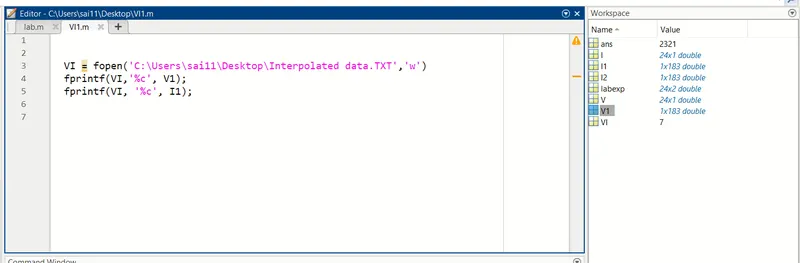
9. Now, the missing data is stored in the .txt file using the fprintf function as shown below.