Project - Data Handling and Interpolation
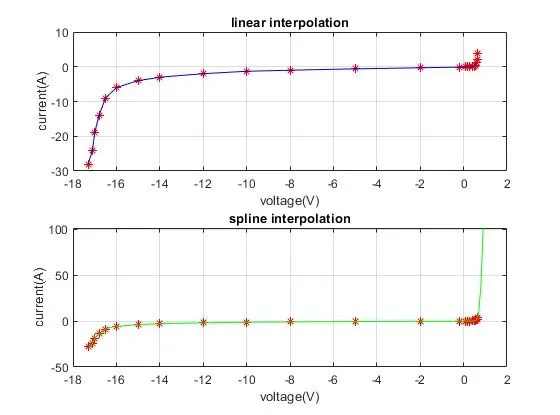
In a laboratory experiment, data of voltage and current has been recorded and the same is attached in an excel file ( Click on this link VI.xlsx ). Read the excel file in the Matlab program and perform the interpolation in the range of -17.3:0.1:0.9. Generate the interactive plot for the interpolated data and store them in a text file.
ANSWER:
Interpolation in Matlab:Interpolation iS used a mathematical and statistical tool to estimate values between any two points.It is a process of finding a value between two points on aline or curve,here we can determine 'y' values corresponding to a specific set of 'x' values.The interpolation option include ,linear ,cubic,and spline.
Syntex : yq = interp1(x,y,xq,'method')
Matlab Code:
% data interpolation of voltage and current
% reading data from xlsx file
data = xlsread('VI.xlsx');
V = data(:,1);
% defing voltage and current values
A = data(:,2);
% interpolation range
xq = -17.3:0.1:0.9;

% starting linear interpolation
xq1 = interp1(V,A,xq);

subplot(211)

plot(V,A,'r*',xq,xq1,'b-');

grid;
title('linear interpolation');
xlabel('voltage(V)');
ylabel('current(A)');

% starting spline interpolation

xq2 = interp1(V,A,xq,'spline');

subplot(212)

plot(V,A,'r*',xq,xq2,'g-');
grid;
title('spline interpolation');
xlabel('voltage(V)');
ylabel('current(A)');

% aving interpolation values to text file

fileid = fopen('VI.txt','w');

fprintf(fileid,'%d/n',V,A);
fclose(fileid);
RESULT: