Project - Data Handling and Interpolation
Project :
In a laboratory experiment, data of voltage and current has been recorded and the same is attached in an excel file ( VI.xlsx ). Read the excel file in the Matlab program and perform the interpolation in the range of -17.3:0.1:0.9. Generate the interactive plot for the interpolated data. Additionally, compute the current values for given voltages below and store them in a text file.
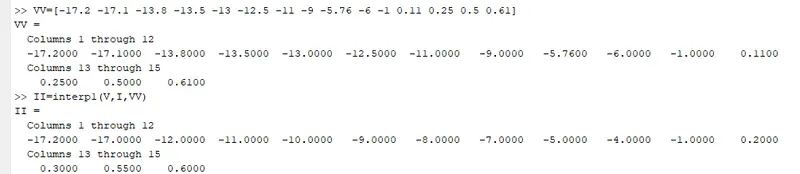
VV =[-17.2 -17.1 -13.8 -13.5 -13.0 -12.5 -11 -9 -5.76 -6 -1 0.11 0.25 0.5 0.61]’
Key Highlights:
- Graphical solutions are more visual and appealing
- Interpolation of data
- Read excel file
- Write to text file
Deliverables:
- Find missing data and save it in text
- Interpolate the data set
- Save your program and attach the same.
- Save txt file and upload in attachment
Answer:-
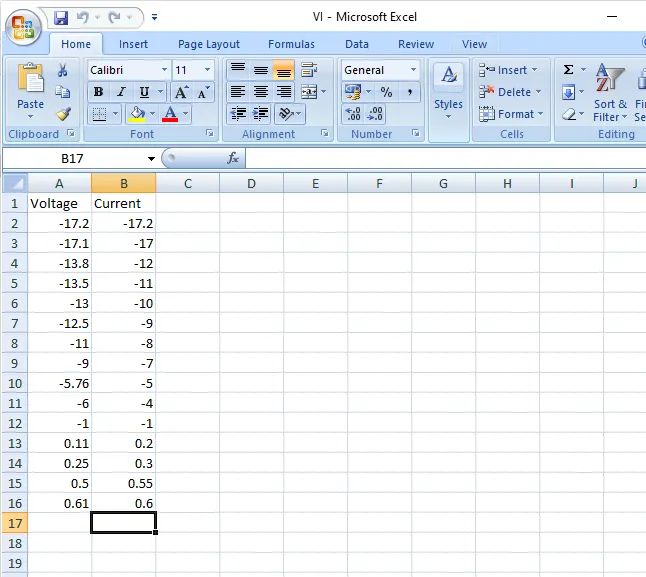
Prepared the excel file with V and I data:-
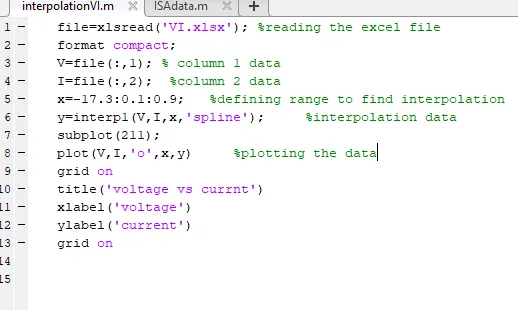
Matlab Code:-
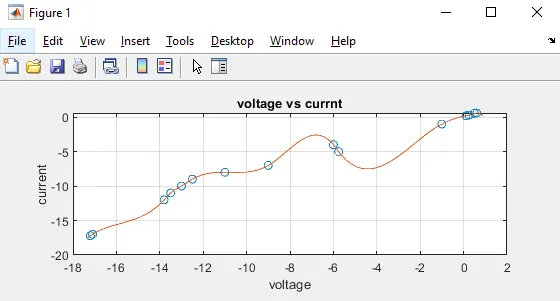
Graph:-
Now finding for VV data given

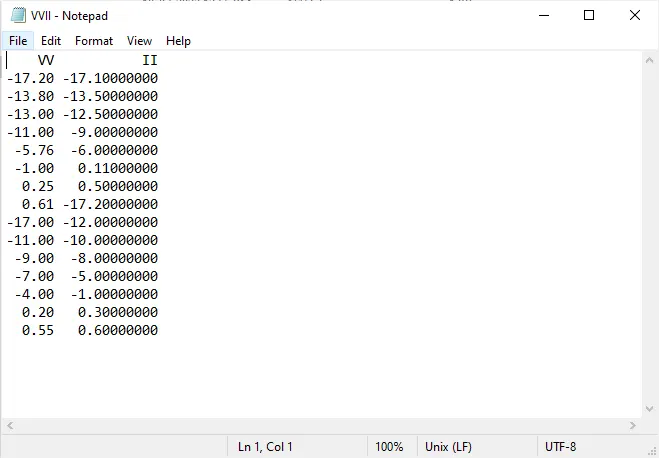
Writing the generated data into the text file: