Project - Data Handling and Interpolation
DATA HANDLING AND INTERPOLATION
Aim:
To perform interpolation of voltage and current in range of -17.3:0.1:0.9.
Project :
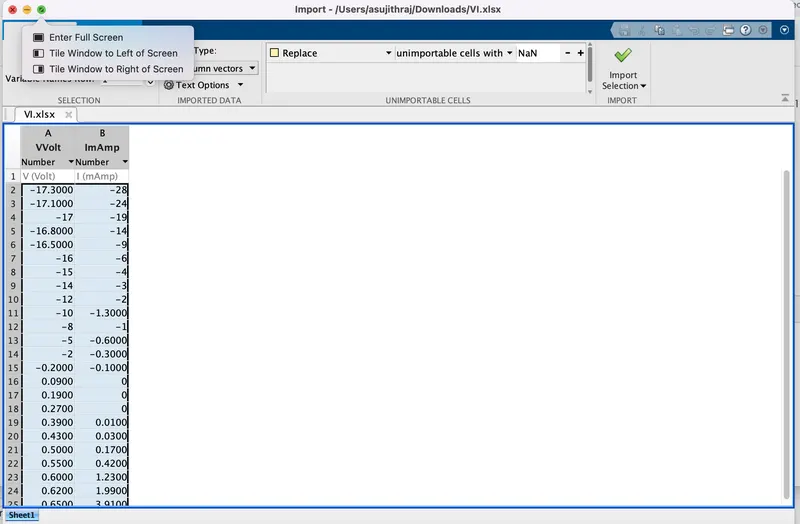
In a laboratory experiment, data of voltage and current has been recorded and the same is attached in an excel file. Read the excel file in the Matlab program and perform the interpolation in the range of -17.3:0.1:0.9. Generate the interactive plot for the interpolated data and store them in a text file.
Key Highlights:
- Graphical solutions are more visual and appealing
- Interpolation of data
- Read excel file
- Write to text file
Deliverables:
- Find missing data and save it in text
- Interpolate the data set
- Save your program and attach the same.
- Save txt file and upload in attachment
Interpolation:
It is the method of using our function to predict the value of the dependent variable for an independent variable that lies within the data set.This works within the given data set. or Interpolation is a method of fitting the data points to represent the value of a function. It has a various number of applications in engineering and science, that are used to construct new data points within the range of a discrete data set of known data points or can be used for determining a formula of the function that will pass from the given set of points (x,y).
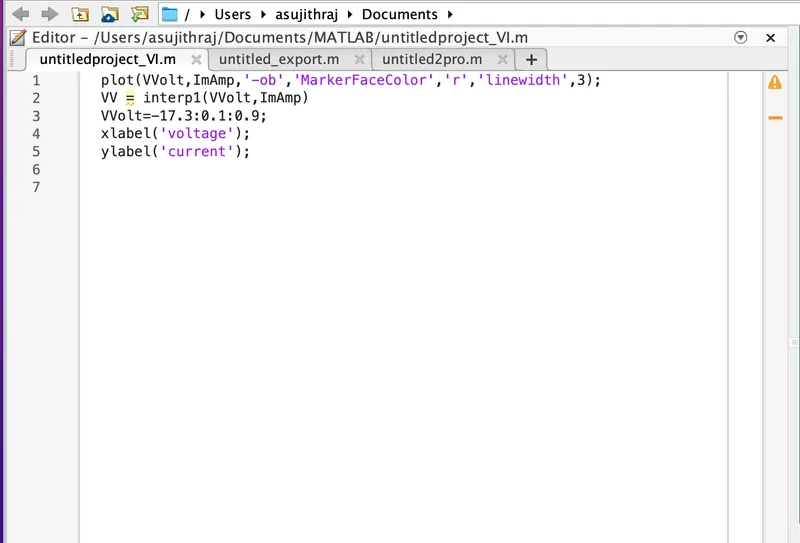
plot(VVolt,ImAmp,'-ob','MarkerFaceColor','r','linewidth',3);
VV = interp1(VVolt,ImAmp)
VVolt=-17.3:0.1:0.9;
xlabel('voltage');
ylabel('current');
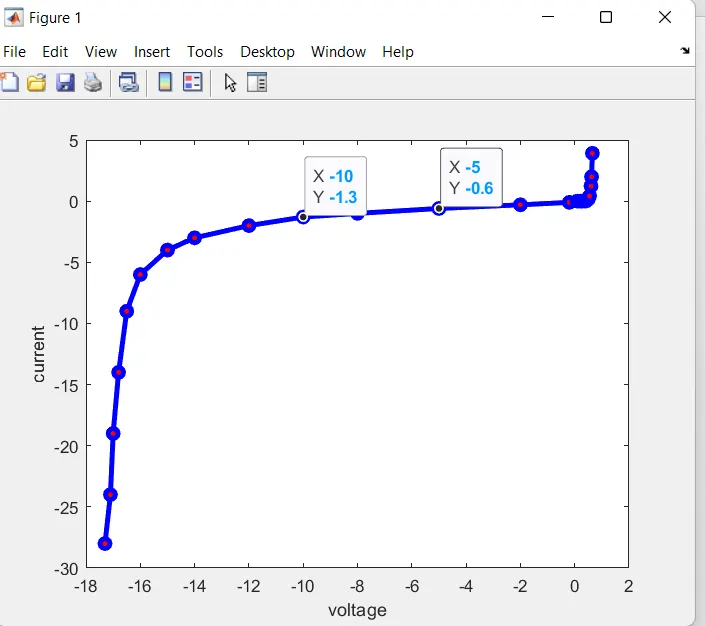
This graph shows about current vs voltage variance
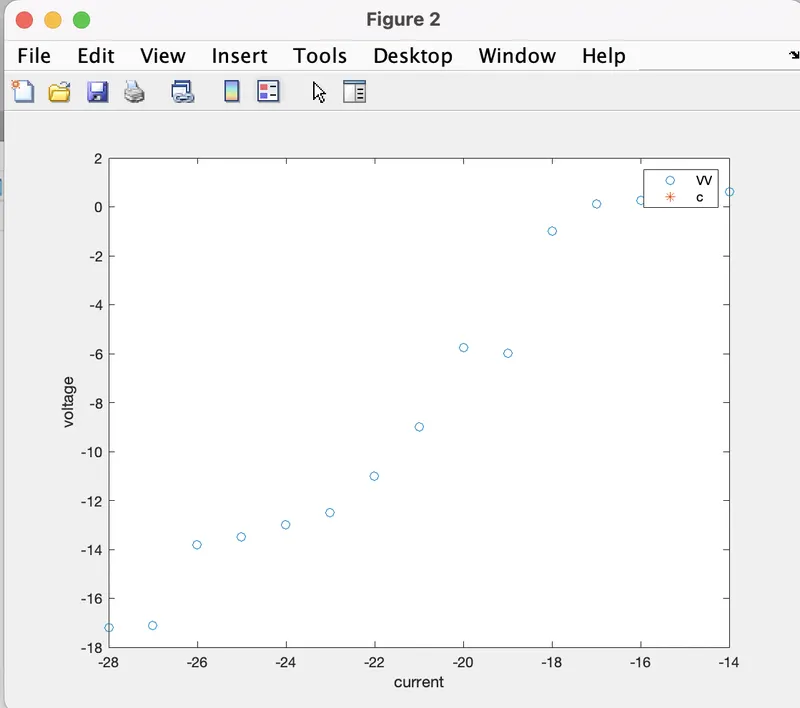
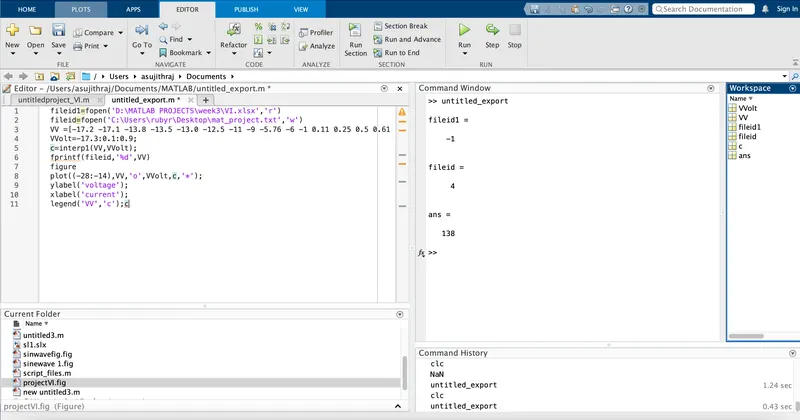
Here we have used the command 'interp1' for interpolation. The output xq1 is put to the text file called 'interpolation'.
Code for interpolation:
fileID = fopen('interpolation.txt','w');        % Open the text file to write the output

x = ImAmp;                                      % defining a variable x from excel file
y = VVolt;                                      % defining a variable y from excel file
xq = [-17.3:0.1:0.9];                           % defining the range for interpolation
xq1 = interp1(y,x,xq);                          % interpolation
figure(1);
plot(x,y,'o',xq,xq1,':');                       % plotting the interpolation
grid;

fprintf(fileID,'%f','xq1');                     % print the output xq1 to the text file
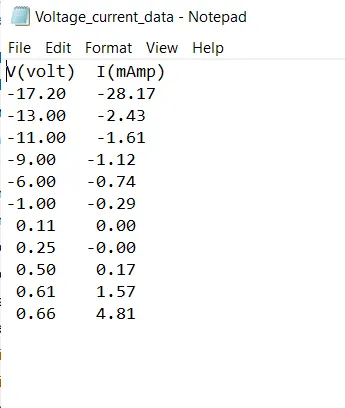
The output text file contains the data of current to the given voltage:
Conclusion:
The excel file is read in the Matlab program and interpolation is performed for the range of -17.3:0.1:0.9.
The interactive plot is generated for the interpolated data and missing data are findout and stored in a text file.