Project - Data Handling and Interpolation
Project: Data Handling and Interpolation
In this laboratory experiment, we have the data on voltage and current from the attachment file excel
(VI.xlsx).
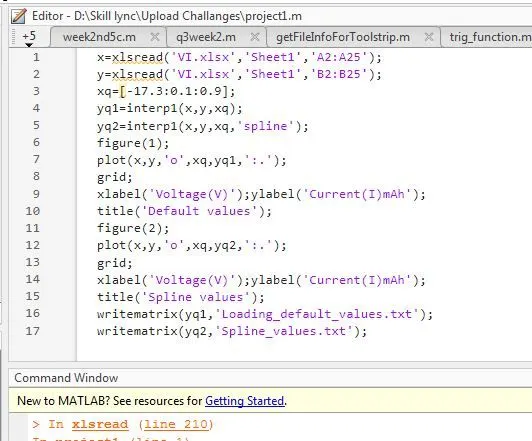
I'm using 'xlsread' function to read these values from that excel file and in the variable form.
variable X - is for Voltage values.
variable Y - is for Current values.
x=xlsread('VI.xlsx','Sheet1','A2:A25');
And we want to interpolate those values in the range of -17.3: 0.1: 0.9 which was in the Voltage values.
xq=[-17.3:0.1:0.9];
I'm using the 'interp1' function for interpolating these values to that range because are having that function.
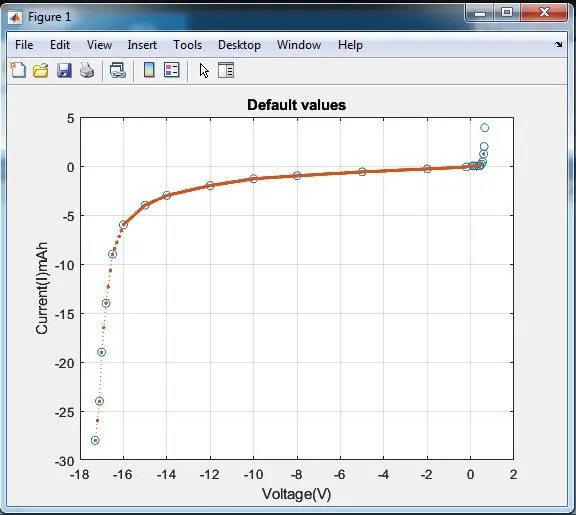
yq1= interp1(x,y,xq); this function gives the default values.
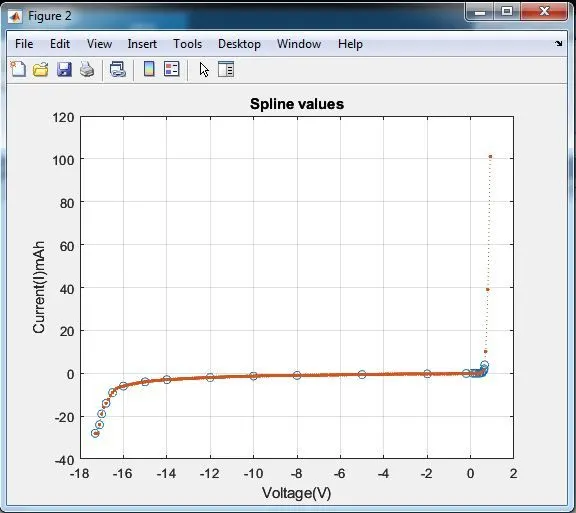
If we want to use values to smooth the way we will use the 'spline' function.
yq2=interp2(x,y,yq1,'spline');
And finally, we have these values in two ways, one is in the default value and then a smoothened value.
And then we plot these values by plot function, But we want a difference between the input value, So I'm using the 'o' points for input values and '.' values for the interpolated values.
plot(x,y,'o',xq,yq1,':.'); for loading normal default values.
plot(x,y,'o',xq,yq2,':.'); for smooth values by spline function.
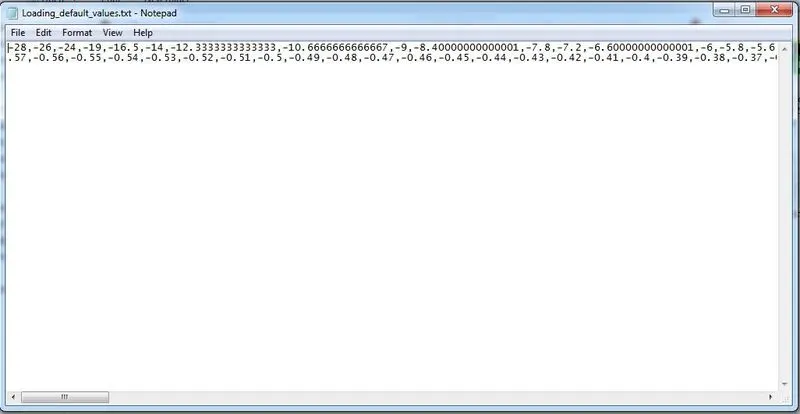
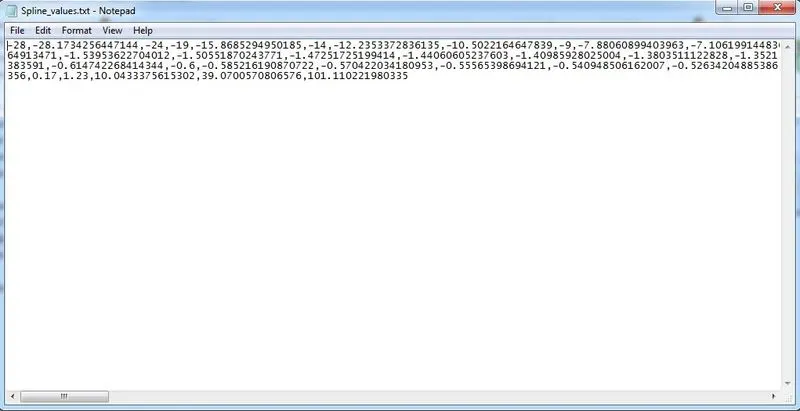
Then we want to store these output values in a text(.txt) file.
In Matlab, we have functions like dlmwrite, xlswrite, and writematrix to store them into a text file.
So, I'm using writematrix function to store these values as a text file.
writematrix(yq1,'Loading_default_values.txt');
writematrix(yq2,'Spline_values.txt');