Project 1
Q.1] In this Project we want to develop the conventional vehicle's forward energy-based fuel consumption model using Matlab and Simulink.
- And also to compute the fuel economy numbers for the given desired vehicle model in kmpl on the two different drive cycle types are UDDS and HWFET.
- By understanding the vehicle operation points in terms of engine speed, torque, transmission speeds, Pedal Position, gear, and Distance travel.
- By Simulating the model using blocks.
Forward modeling of Vehicle :
Forward-facing models represent dynamic models with the correct causality. A forward-facing vehicle model features a driver model, which provides torque demand in the form of desired ICE torque and brake torque (positive and negative torque), to meet the speed trace from a drivecycle.
- This approach is based on the vehicle dynamics equation.
- A Driver Controller is required to control the vehicle to follow desired speed and to calculate.
- The Controller is implemented to model that the driver will either push the accelerator or the brake pedal to match the desired speed which enables to study the braking of the vehicle
- It also acts as a feedback loop for the vehicle which was used to determine the energy requirements to drive the vehicle.
Conventional Vehicle Model:
In this project, we have the instructions to follow in steps. Because of this, the Simulation will process in 3 stages.
- Project Initialization (Pre Processing)
- Simulation
- Post processing
Pre Processing :
In this Stage data which load as a program, it will take as an input program of the vehicles which is used for Post-processing of the Simulation by using the Simulink Model which is already built
Drive Cycle selection is also done from here by choosing the variable in it eg:1 is for UDDS, 2 is for HWFET, and 3 is for FTP.
Then we want to write the initial parameters data of the Vehicle Dynamics is Consists of a typical 4-gear vehicle.
Drive Cycle which was used in this program is US-based Vehicles Dynamics
By the Changing the variable input for selecting different Drive_cycle
1 UDDS
2 HWFET
3 FTP
4 US06
5 NEDC
6 WLTP
Simulink Modeling :
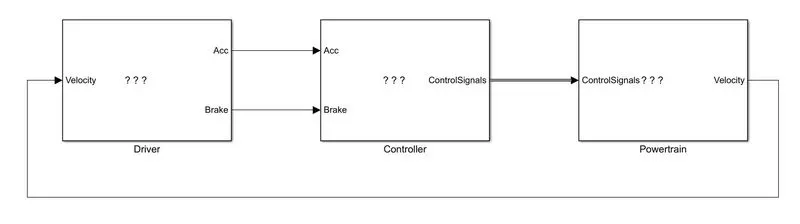
The Model of Simulink is for the convection model of the vehicle in which it has been divided into 3 main sub-blocks are:
- Driver
- Controller
- Powertrain
The Actual Vehicle speed is given as feedback to the driver block, and the driver block gives into the controller block in which the acceleration or brake output is connected.
While the controller provides a control signal for engine torque, gear shifting, and brake torque to the powertrain block.
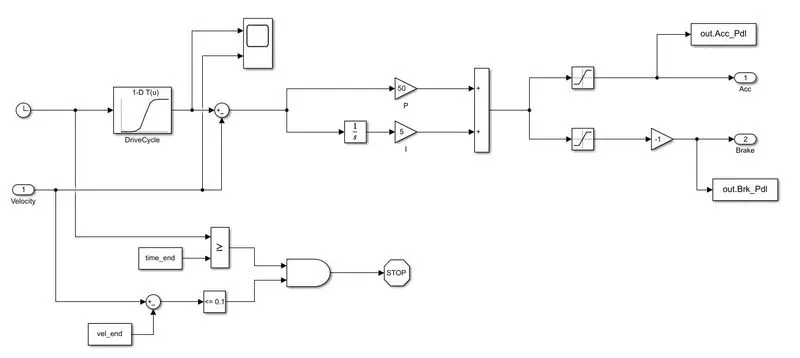
Driver:
In this Driver Block, it is a basic PI controller model that is used to generate accelerator and brake pedal Outputs that are used to match the desired and actual vehicle speeds.
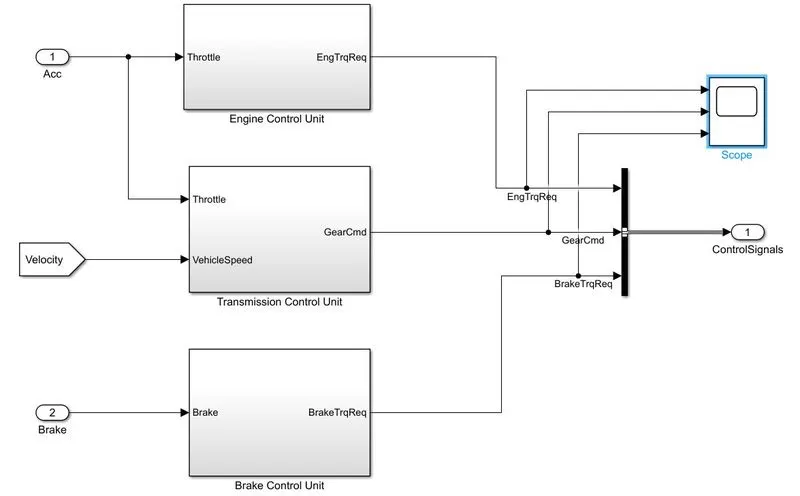
Controller Unit:
The brain of the vehicle unit is the 'Controller' block, which represents the ECU, Transmission Unit, and Basic Control Unit
Based on the Driver Inputs, it generates desired engine Torque, desired transmission gear, and desired brake torque. These will be sent as feedback to the powertrain blocks as input which is represented the drivetrain of the vehicle.
Engine Control Unit:
In this Block, ECU is the main unit that used to run the vehicle
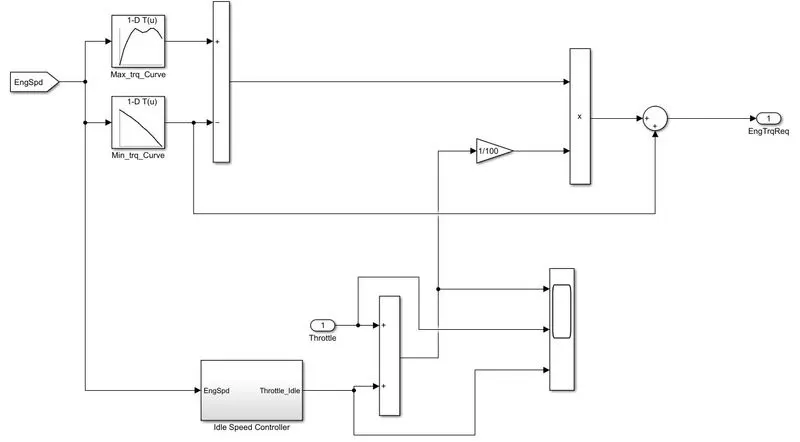
Inputs such as Engine Speed, Maximum Torque Curve, Minimum Torque Curve, Idle Speed Control and the output is Engine Torque.
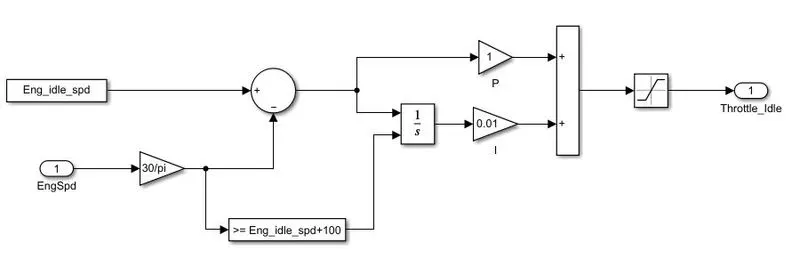
Idle Speed Controller :
Transmission Control Unit:
This Control unit has 2 inputs whereas Throttle, Vehicle Speed, and Gear Command as Output.
Has Increasing the Input Throttle speed, Changing of gear commands take place accordingly 1,2,3,4 and vice versa for speed dropping condition.
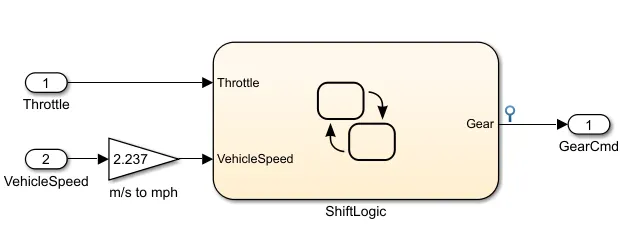
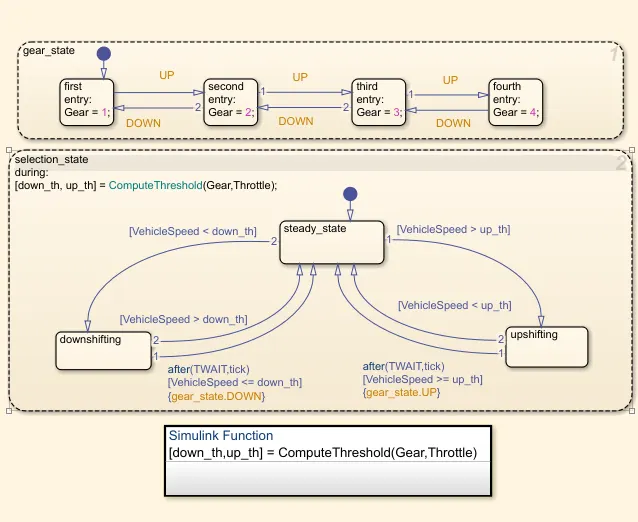
The Gear command is been created by using the Stateflow block for this simulation.
It is been controlled accordingly by Vehicle Speed and Throttle inputs.
The gear command is been passed to the transmission block to select the desired gear ratio.
Brake Control Unit:
It consists of the basic control unit which requires brake torque according to the brake pedal input and passes the brake torque into the wheel block in the transmission model.
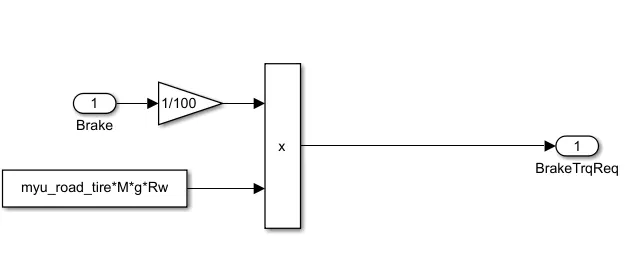
Powertrain :
A powertrain is a system inside a vehicle, boat or another type of machinery. The system is designed to propel the vehicle forward. In a car, a powertrain consists of the engine or motor and its internal components, such as the energy storage system, transmission and driveshaft.
To move up the vehicle we need a Body structure that is used to move the vehicle in forward and reverse directions as required.
It consists of an Engine, Transmission, Wheels, Differential, Vehicle Dynamics
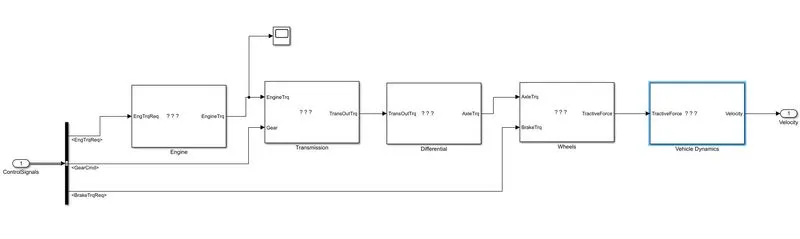
Engine :
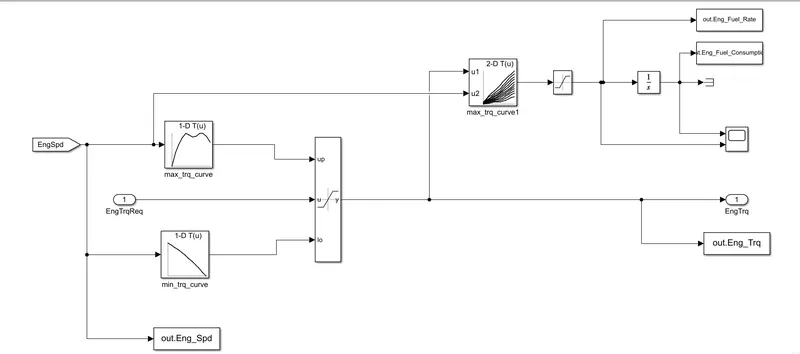
Based on the Engine Speed, the required torque from the controller is between Max torque and Min Torque curve and it will transfer the Engine Torque to the Transmission Block.
The 2D lookup table is used to calculate the fuel rate and is then integrated to find the fuel consumption rate of the engine, by using the engine speed and engine torque.
By using the 'To Workspace' block command the estimated fuel flow rate, fuel consumption, engine torque, and engine speed is been passed to the workspace of MATLAB.
To see the output of Engine Flow rate and Fuel Consumption is been scoped.
Transmission :
The input of the block is coming from the Engine model named 'Engtrq'.
This input is connected to Torque Converter and this output is connected to a differential which is named 'TransOutTrq'.
Torque Converter :
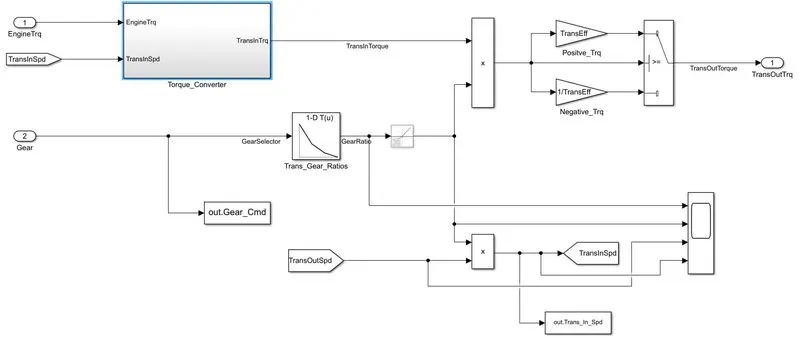
A torque converter is a type of fluid coupling that transfers rotating power from a prime mover, like an internal combustion engine, to a rotating driven load. In a vehicle with an automatic transmission, the torque converter connects the power source to the load. It is usually located between the engine's flexplate and the transmission. The equivalent location in a manual transmission would be the mechanical clutch.
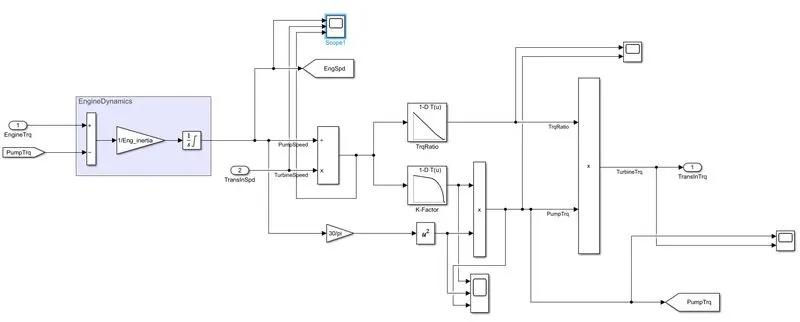
In this block, the gear selection from the transmission control unit is been multiplied by the engine torque in this block and the engine dynamics of the torque converter are applied in this model.
Differential :
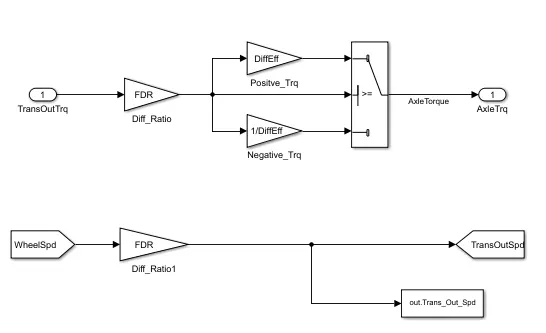
The Transmission output torque is multiplied by the differential ratio and differential eff in these blocks and the torque is transmitted to the wheel as the axle torque.
Wheel Model:
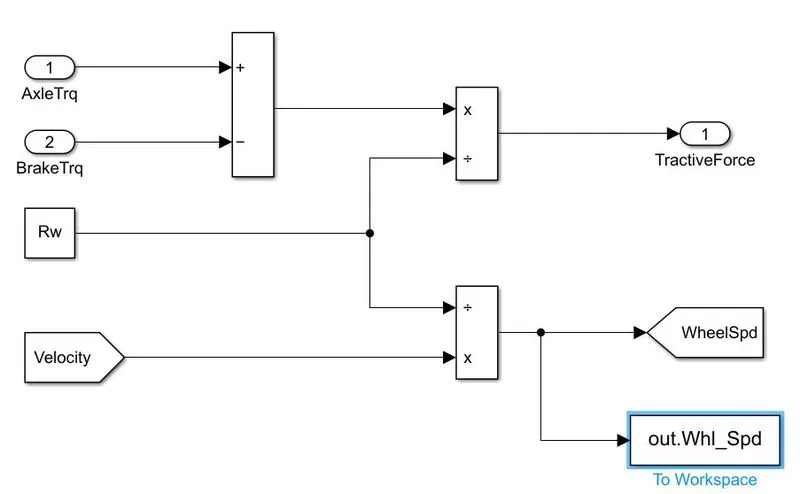
This takes input from brake torque in the control model is been subtracted from the axle torque and divided from the rolling radius to determine the tractive force.
The wheel speed is calculated from the vehicle velocity and saved into the workspace.
Vehicle Dynamics:
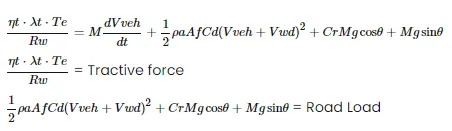
This block consists of the longitudinal dynamics of the vehicle which consists of Aerodynamics force, Rolling Resistance Force, Grade Force etc..,
Formulas used:
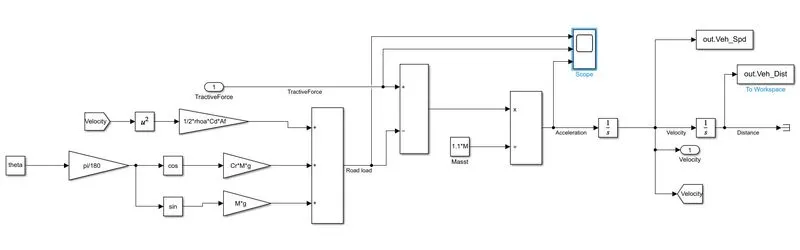
After creating this above model, we'll run this and analyze the outputs for Drive Cycles.
Drive cycles of UDDS and HWFET cycles:
UDDS stands for Urban Dynamometer Driving Schedule, and refers to a United States Environmental Protection Agency mandated dynamometer test on fuel economy that represents city driving conditions which is used for light duty vehicle testing.
HWFET: The Highway Fuel Economy Test (HWFET or HFET) cycle is a chassis dynamometer driving schedule developed by the US EPA for the determination of fuel economy of light duty vehicles. The HWFET is used to determine the highway fuel economy rating, while the city rating is based on the FTP-75 test.
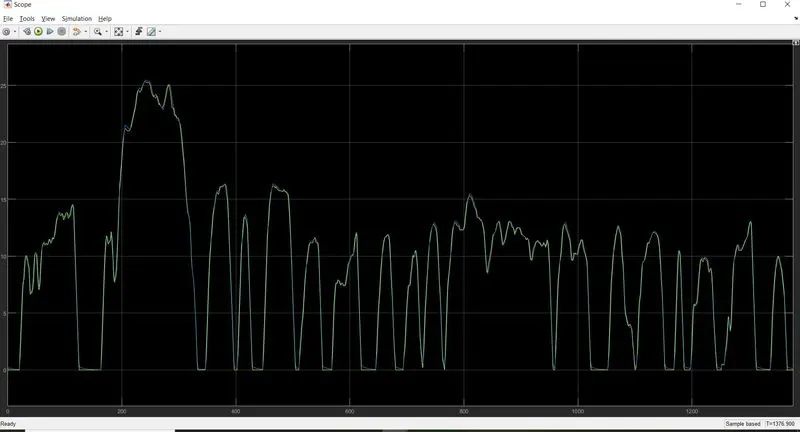
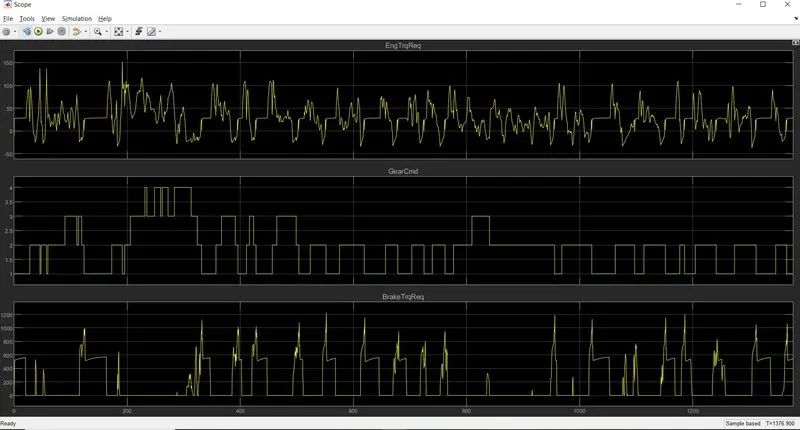
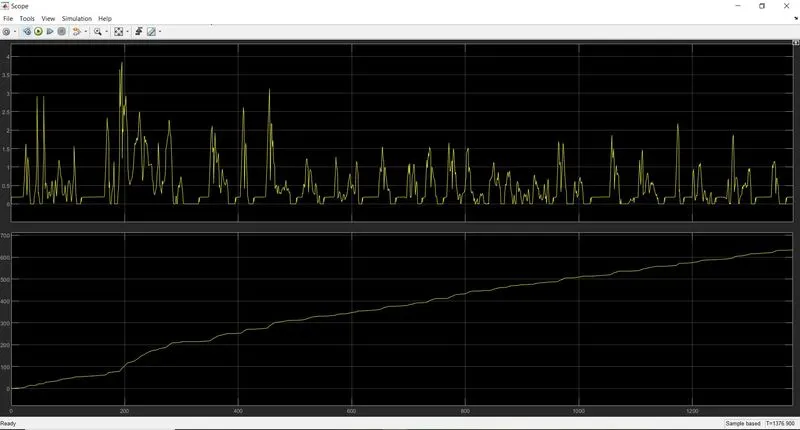
The Outputs for UDDS cycle :
Drive cycles and Actual velocity:
Engine Torque, Gear Command, and Brake Torque:
Engine Fuel Rate, Engine Fuel Consumption :
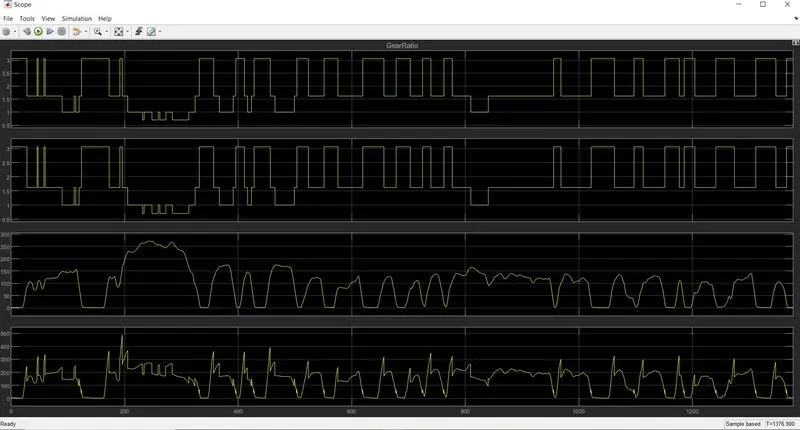
Gear Ratio, Transmission Input, Transmission Output:
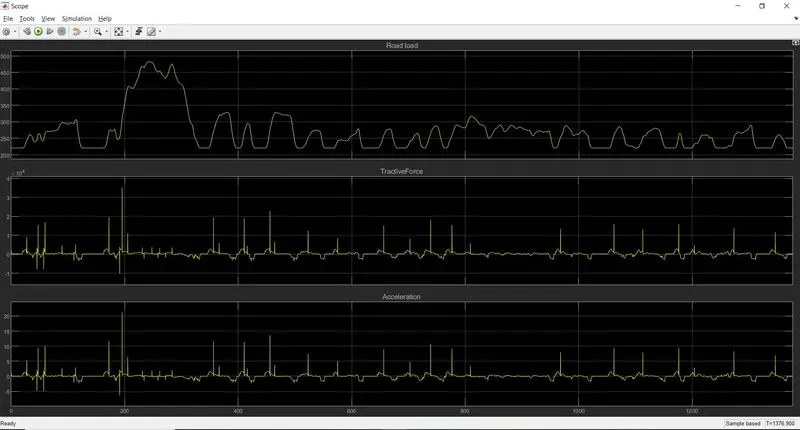
Road Load, Tractive Force, Acceleration:
For HWFET Cycles:
The Highway Fuel Economy Test (HWFET or HFET) cycle is a chassis dynamometer driving schedule developed by the US EPA for the determination of fuel economy of light-duty vehicles [40 CFR 600, subpart B]. The HWFET is used to determine the highway fuel economy rating, while the city rating is based on the FTP-75 test.
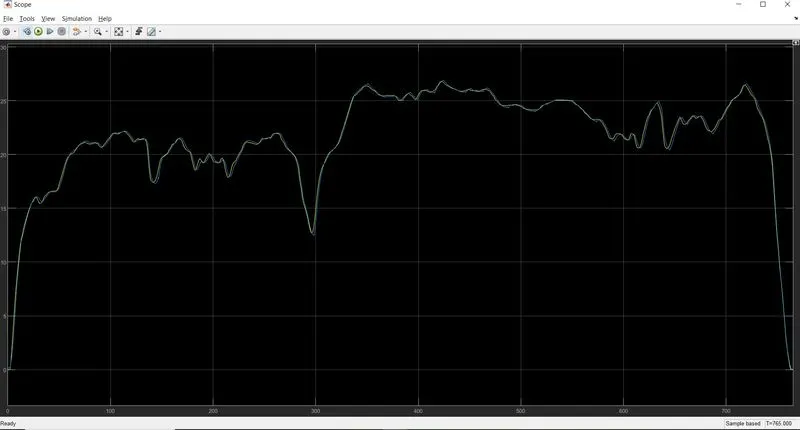
Drive cycles and Actual velocity:
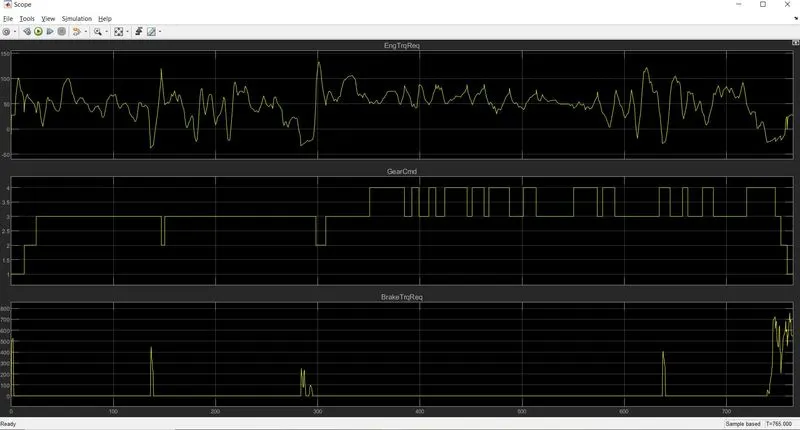
Engine Torque, Gear Command, and Brake Torque:
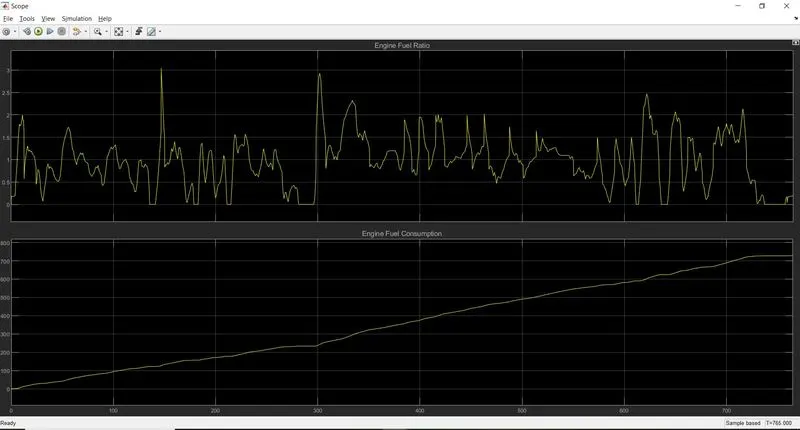
Engine Fuel Rate, Engine Fuel Consumption :
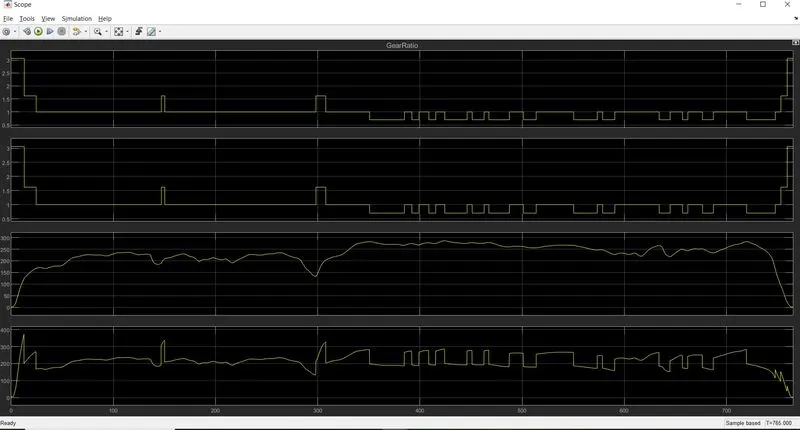
Gear Ratio, Transmission Input, Transmission Output:
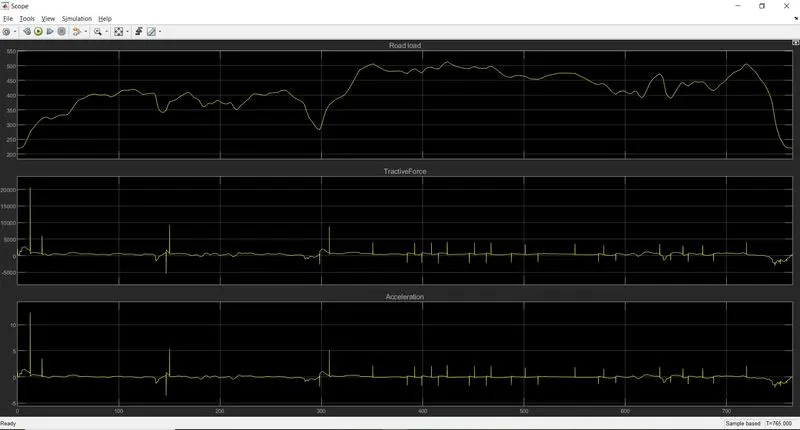
Road Load, Tractive Force, Acceleration:
POST-PROCESSING:
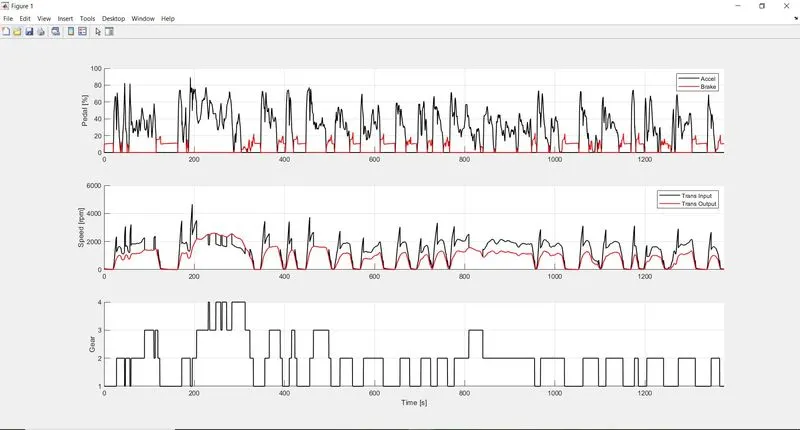
In this Post-processing, a MATLAB script is created to analyze data and generate plots and for some variables, I have renamed for loaded model and then plotted the results.
After running this script we'll get these results,
For UDDS Cycle :
1.Vehicle characteristics time trace :
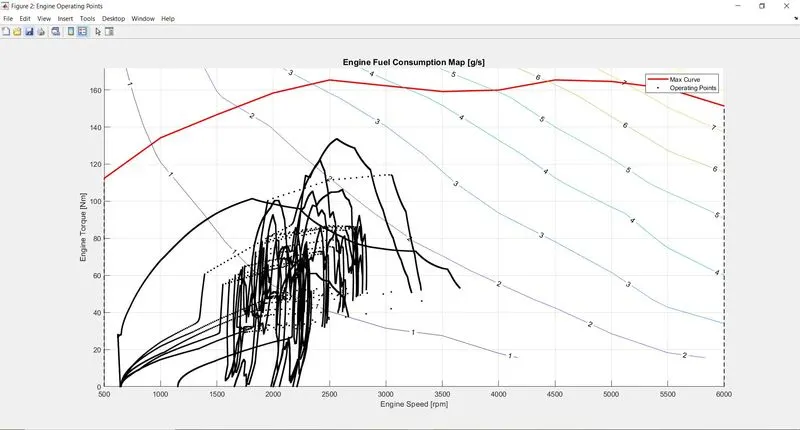
2.Engine Operating Points :
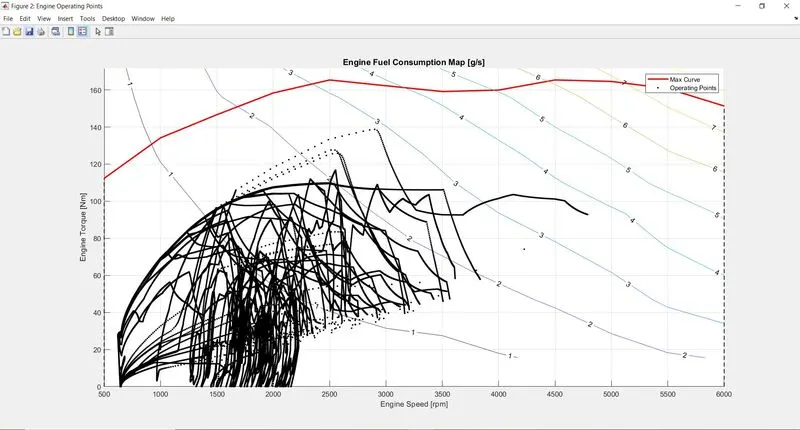
For HWFET Cycle :
nFuel Economy = 16.31Kmplnn
1.Vehicle characteristics time trace
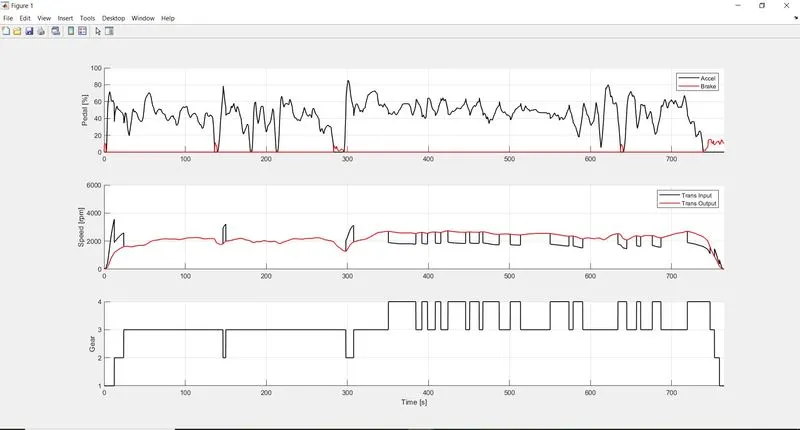
2.Engine Operating Points :