Project - Data Handling and Interpolation
DATA HANDLING AND INTERPOLATION
OBJECTIVE:
In a laboratory experiment, data of voltage and current has been recorded and the same is attached in an excel file ( Click on this link VI.xlsx ). Read the excel file in the Matlab program and perform the interpolation in the range of -17.3:0.1:0.9. Generate the interactive plot for the interpolated data and store them in a text file.
INTRODUCTION:
Interpolation:
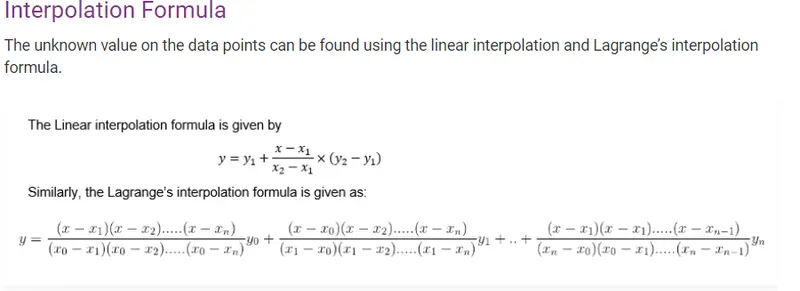
It is the method of using our function to predict the value of the dependent variable for an independent variable that lies within the data set.This works within the given data set. or Interpolation is a method of fitting the data points to represent the value of a function. It has a various number of applications in engineering and science, that are used to construct new data points within the range of a discrete data set of known data points or can be used for determining a formula of the function that will pass from the given set of points (x,y).
Matlab fnction used:
interp1
vq = interp1(x,v,xq)x contains the sample points, and v contains the corresponding values, v(x). Vector xq contains the coordinates of the query points.
If you have multiple sets of data that are sampled at the same point coordinates, then you can pass v as an array. Each column of array v contains a different set of 1-D sample values
MATLAB Script:
%project
%Done by - B.Riyaz
%Data handling and Interpolation
clear all
close all
clc

%reading the given excel file
A = xlsread('VI');
V = A(:,1); %voltage data
I = A(:,2); %current data

%Interpolation range
Vint = [-17.3:0.1:0.9];
%linear interpolation
ILint = interp1(V,I,Vint);
%spline interpolation
ISint = interp1(V,I,Vint,'spline');

%comparing the plotof experimental data,linear interpolation data, splineinterpolation data
figure(1)
subplot(3,1,1)
plot(V,I,'o');%Experimental data
title('Experimental data');
xlabel('Voltage V');
ylabel('Current I');
axis([-20 3 -30 20]);

subplot(3,1,2)
plot(Vint,ILint);%linear interpolation plot
title('Linear interpolation');
xlabel('Voltage V');
ylabel('Current I');
axis([-20 3 -30 20]);

subplot(3,1,3)
plot(Vint,ISint);%spline interpolation plot
title('spline interpolation');
xlabel('Voltage V');
ylabel('Current I');
axis([-20 3 -40 120]);

figure(2)
plot(V,I,'o',Vint,ILint,'r',Vint,ISint,'b');
title('comparision');
xlabel('Voltage V');
ylabel('Current I');
legend('Exp data','Linear','Spline');

%Find out missing data of current for given voltage data
%voltage data given
Vdata = [-17.2 -13	-11	-9 -6 -1 0.11 0.25 0.5 0.61 0.66];
%finding out missing current data for the given voltage
Idata = interp1(V,I,Vdata,'spline'); %using spline interpolation

%plotting interpolated missing data
figure(3)
plot(Vdata,Idata,'r');
title('Data interpolation');
xlabel('Voltage V');
ylabel('Current I');
legend('calculated missing current data');

%Writing the calclated data in txt file
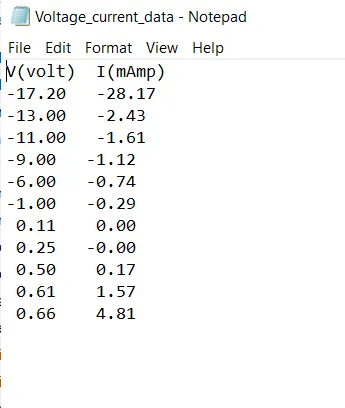
f1 = fopen('Voltage_current_data.txt','w');
fprintf(f1,'%s %s \n','V(volt)',' I(mAmp)');
for i = 1:length(Vdata)
    fprintf(f1,'%5.2f   %5.2f \n',Vdata(i),Idata(i));
end
fclose(f1);


%end of program
Script explanation:
xlsread command is used read the voltage and current from the file
Vint are the given range for which the data has to be interpolated
The interpolation is done using the interp1 matlab function.
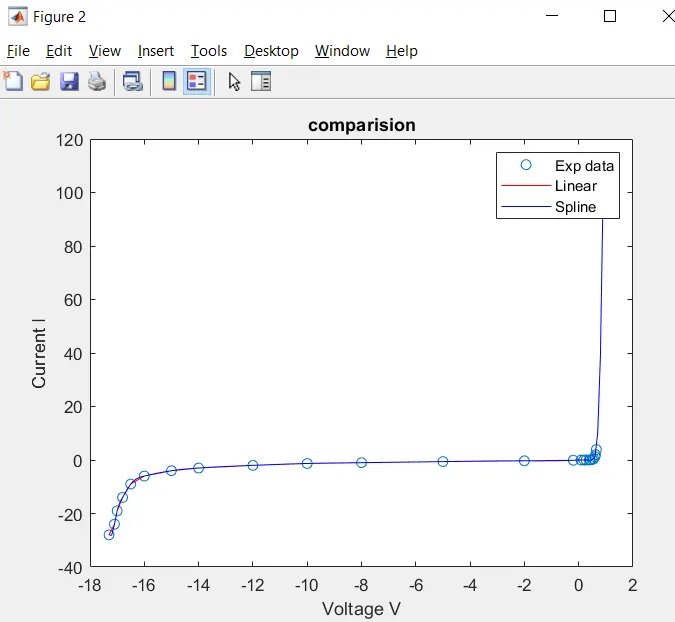
The both linear and spline interpolation is done here to get the best results.
%linear interpolation
ILint = interp1(V,I,Vint);
%spline interpolation
ISint = interp1(V,I,Vint,'spline');
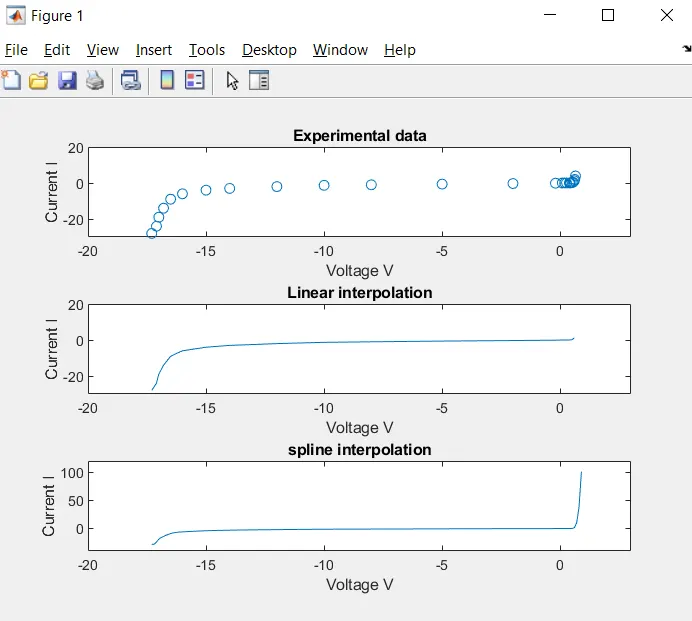
The subplot command is used to plot the experimental data, linear interpolation data and the spline interpolation data.
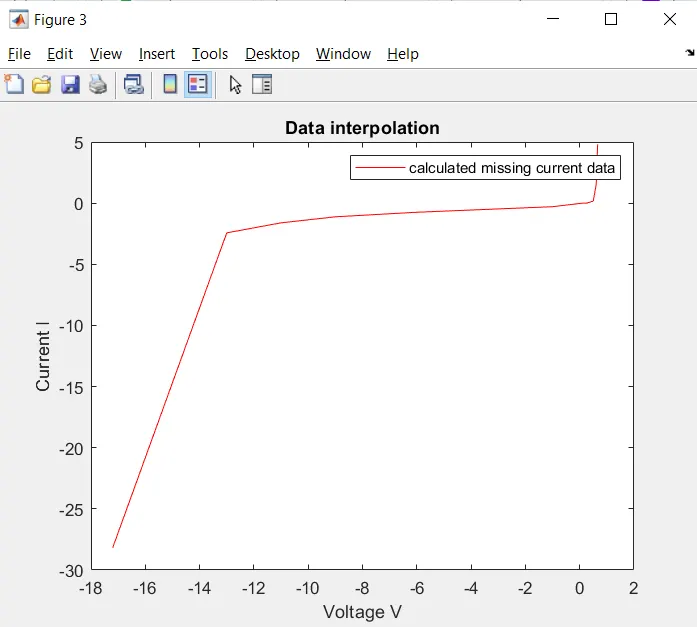
The given voltage data in the second sheet of excel file which have the missing current data respective to the voltage is taken and the data is findout using the interpolation
%Find out missing data of current for given voltage data
%voltage data given
Vdata = [-17.2 -13 -11 -9 -6 -1 0.11 0.25 0.5 0.61 0.66];
%finding out missing current data for the given voltage
Idata = interp1(V,I,Vdata,'spline'); %using spline interpolation
The findout data is write in the text file and save using the fopen,fprintf,fclose commands.
Results:
The subplots showing the experimental data,linear interpolation data and spline interpolation data.
Comparision of the data:
The findout missing data of current and voltage plot:
The output text file contains the data of current to the given coltage:
Conclusion:
The excel file is read in the Matlab program and interpolation is performed for the range of -17.3:0.1:0.9.
The interactive plot is generated for the interpolated data and missing data are findout and stored in a text file.
Thank you
Submitted by
B.Riyaz