Project 2 - Rankine cycle Simulator
AIM:
To create a rankine cycle simulator using matlab and plot the T-S and H-S diagram and calculating the state points.
SOLUTION:
RANKINE CYCLE:
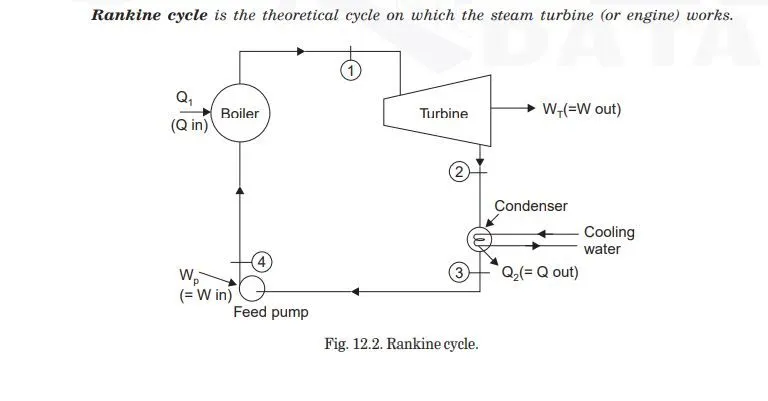
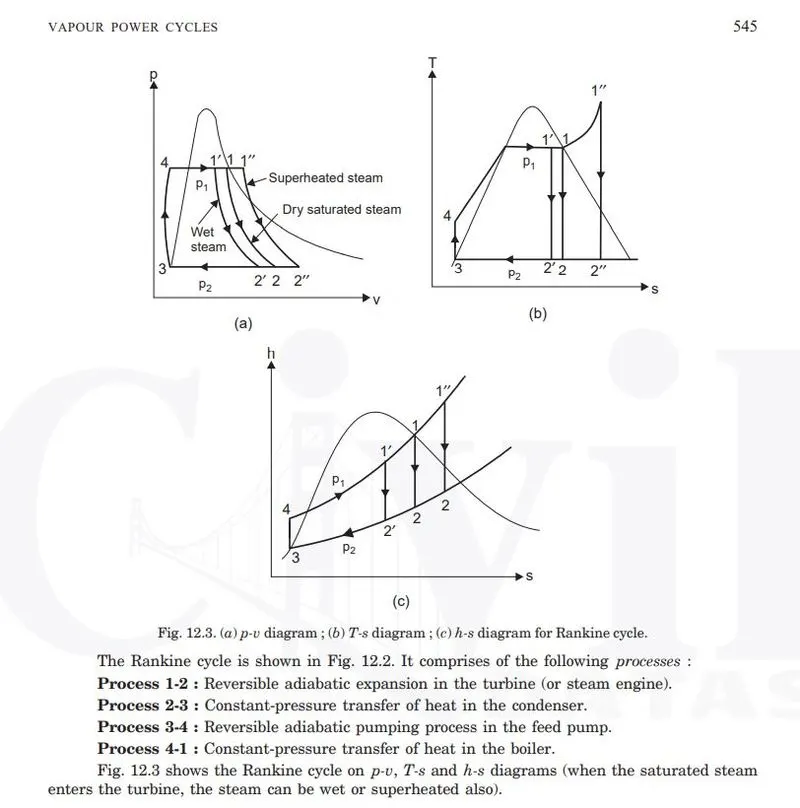
MATLAB PROGRAM:
%Rankine cycle simulation
clear all
close all
clc

fprintf('\n                         RANKINE CYCLE SIMULATOR\n')
fprintf('\n process 1-2 isentropic expansion in turbine/n')
fprintf('\n process 2-3 constant pressure heat rejection in condenser')
fprintf('\n process 3-4 Isentropic compression in pump')
fprintf('\n process 4-1 constant pressure heat addition by the boiler\n')

%process 1-2 isentropic expansion in turbine
%process 2-3 constant pressure heat rejection in condenser
%process 3-4 Isentropic compression in pump
%process 4-1 constant pressure heat addition by the boiler

%required inputs
%Turbine Inlet temperature = 400° C
t1 = 400;
%Turbine Inlet Pressure = 44 bars
p1 = 30;
%Turbine Outlet Pressure = 0.05 bars = Condenser Inlet Pressure
p2= 0.05;

p3=p2;
p4=p1;

fprintf('\n Enter the pressure at the turbine inlet(in bar): %f',p1)
fprintf('\n Enter the temperature at the turbine inlet(in degree celcius): %f',t1)
fprintf('\n Enter the pressure at the condenser inlet (in bar): %f',p2)

%state 1 variables
h1 = XSteam('h_pT',p1,t1);
s1 = XSteam('s_pT',p1,t1);

%state 2 variables
%t2 = t3
%p2
t2 = XSteam('Tsat_p',p2);
t3 = t2;

%h2 = hf2+x2*hfg2
s2 = s1;
%s2 = sf2+x2*sfg2
sf2 = XSteam('sL_p',p2);
sg2 = XSteam('sV_p',p2);
hf2 = XSteam('hL_p',p2);
hg2 = XSteam('hV_p',p2);
x2 = ((s2 - sf2) /(sg2-sf2));
h2 = hf2 + (x2*(hg2-hf2));


%state 3 variables
%p3,t3 known

h3 = XSteam('hL_p',p3);
s3 = XSteam('SL_p',p3);
v3 = XSteam('vL_p',p3);

%state 4 variables
%p4 known
s4 =s3;
%gaama = cp4/cv4
%cp4-cv4 =R
cp4 = XSteam('Cp_ps',p4,s4);
cv4 = XSteam('Cv_ps',p4,s4);
gaama4 = cp4/cv4;
r = (gaama4-1)/gaama4;
t4 = t3*((p4/p3)^r);

%state 5 and 6 variables
t5 = XSteam('Tsat_p',p1);
t6=t5;

hL5 = XSteam('hL_p',p1);
sL5 = XSteam('sL_p',p1);
hV6 = XSteam('hV_p',p1);
sV6 = XSteam('sV_p',p1);

%workdone by pump
%wp = hf4-hf3
%hf4-hf3 = v3(p1-p2)*10^5 J/kg;

wp = v3*(p4-p3)*100;
h4 = h3+wp;

%workdone by turbine
%wt = h1 - h2
wt = h1-h2;
%net work done
wnet = wt-wp;
%heat transfer in boiler
Qin = h1-h4;
%heat transfer in condenser
Qout = h2-h3;
%Thermal efficiency of rankine cycle
Ntherm = ((wnet/Qin)*100);
%specific steam consumption
ssc = 3600/wnet;
%back work ratio
%bwr = wp/wt
bwr = wp/wt;


%T-S Diagram
figure(1)
hold on

Temp = linspace(10,550,500);
for i = 1:length(Temp);
   s_l(i) =  XSteam('sL_T',Temp(i));
   s_v(i) =  XSteam('sV_T',Temp(i));
   h_l(i) =  XSteam('hL_T',Temp(i));
   h_v(i) =  XSteam('hV_T',Temp(i));
end
  plot(s_l,Temp,'LineWidth',1,'Color','b');
  plot(s_v,Temp,'LineWidth',1,'Color','b');

%getting the saturation curve wrt to pressure and temp from state 5 to state 1
  TS = linspace(t5,t1,400);
  for j =1:length(TS)
      swrtpt(j) = (XSteam('s_pT',p1,TS(j)));%swrtpt=s with respect to pressure and temperature
  end


plot(s1,t1,'Color','g','Marker','*')
text(s1,t1,'1');
plot(s2,t2,'Color','g','Marker','*')
text(s2,t2,'2');
plot(s3,t3,'Color','g','Marker','*')
text(s3,t3,'3','HorizontalAlignment','center','VerticalAlignment','top');
plot(s4,t4,'Color','g','Marker','*')
text(s4,t4,'4','HorizontalAlignment','center','VerticalAlignment','bottom');
plot(sL5,t5,'Color','g','Marker','*')
text(sL5,t5,'5','HorizontalAlignment','right','VerticalAlignment','bottom');
plot(sV6,t6,'Color','g','Marker','*')
text(sV6,t5,'6','HorizontalAlignment','center','VerticalAlignment','top');
plot([s1 s2 s3 s4 sL5 sV6 ],[t1 t2 t3 t4 t5 t6 ],'LineWidth',1,'Color','r')
plot(swrtpt,TS,'Color','r','LineWidth',1);
title('T-S DIAGRAM');
xlabel('Entropy-S');
ylabel('Temperature-T');
legend('sat-curve','Location','northwest');


%H-S Diagram
figure(2)
hold on
plot(s_l,h_l,'LineWidth',2,'Color','b');
plot(s_v,h_v,'LineWidth',2,'Color','b');
plot(s1,h1,'Color','g','Marker','*')
text(s1,h1,'1');
plot(s2,h2,'Color','g','Marker','*')
text(s2,h2,'2');
plot(s3,h3,'Color','g','Marker','*')
text(s3,h3,'3','HorizontalAlignment','center','VerticalAlignment','top');
plot(s4,h4,'Color','g','Marker','*')
text(s4,h4,'4','HorizontalAlignment','center','VerticalAlignment','bottom');
plot([s1 s2 s3 s4 s1],[h1 h2 h3 h4 h1],'LineWidth',1,'Color','r');
title('H-S DIAGRAM');
xlabel('Entropy-S');
ylabel('Enthalpy-H');
legend('sat-curve','Location','northwest');

%printing the result
fprintf('\n                 ____________RESULTS______________')
fprintf('\n At state point 1:')
fprintf('\n P1 is: %f bar',p1)
fprintf('\n T1 is: %f Degree celsius',t1)
fprintf('\n H1 is: %f KJ/kg',h1)
fprintf('\n S1 is: %f KJ/kgk',s1)
fprintf('\n')

fprintf('\n At state point 2:')
fprintf('\n P2 is: %f bar',p2)
fprintf('\n T2 is: %f Degree celsius',t2)
fprintf('\n H2 is: %f KJ/kg',h2)
fprintf('\n S2 is: %f KJ/kgk',s2)
fprintf('\n')

fprintf('\n At state point 3:')
fprintf('\n P3 is: %f bar',p3)
fprintf('\n T3 is: %f Degree celsius',t3)
fprintf('\n H3 is: %f KJ/kg',h3)
fprintf('\n S3 is: %f KJ/kgk',s3)
fprintf('\n')

fprintf('\n At state point 4:')
fprintf('\n P4 is: %f bar',p4)
fprintf('\n T4 is: %f Degree celsius',t4)
fprintf('\n H4 is: %f KJ/kg',h4)
fprintf('\n S4 is: %f KJ/kgk',s4)
fprintf('\n')

fprintf('\n Workdone by turbine Wt is : %f KJ/kg',wt)
fprintf('\n Workdone by Pump Wp is : %f KJ/kg',wp)
fprintf('\n Net Workdone Wnet is : %f KJ/kg',wnet)
fprintf('\n Thermal efficiency Ntherm is : %f percent',Ntherm)
fprintf('\n Specific steam consumpton SSC is : %f KJ/kwh',ssc)

%END
EXPLANATION OF PROGRAM OF CALCULATING STATE POINTS:
- Initially print the process 1-2,2-3,3-4 and 4-1 using fprintf command.
- %process 1-2 isentropic expansion in turbine
%process 2-3 constant pressure heat rejection in condenser
%process 3-4 Isentropic compression in pump
%process 4-1 constant pressure heat addition by the boiler - Define the given input values
- %required inputs
%Turbine Inlet temperature = 400° C
t1 = 400;
%Turbine Inlet Pressure = 44 bars
p1 = 30;
%Turbine Outlet Pressure = 0.05 bars = Condenser Inlet Pressure
p2= 0.05; - process 2-3 and 4-1 is constant pressure process so p3=p2 and p4=p1.
- Xsteam function is like the steam table using the XSteam function command we get the values of entropy,enthalpy,temperature,pressure for the state points we need.
- calculate the enthalpy,entropy,temp for all the state points using the formula and XSteam function.
- calculate the work done by pump,work done by turbine,net work done, heat transfer in boiler,heat transfer in condenser,thermal efficiency and specific steam consumption ,back work ratio using the formulas of rankine cycle referred from text book.
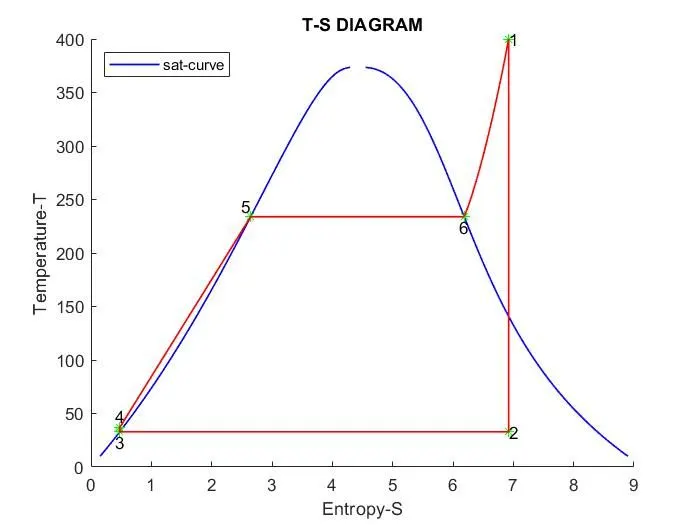
- Plotting of T-S diagram
- To get the saturation curve for the liquid and vapour separately using the linspace command and for loop calculate the entropy and enthalpy for the given temperature range.
- To get and plot the exact curve from the state points 5 to 1 using linspace and for loop calculate the entropy for the respective pressure and temperature.
- plot the state points and saturation dome curve using the plot commands and display the state points using the text command.
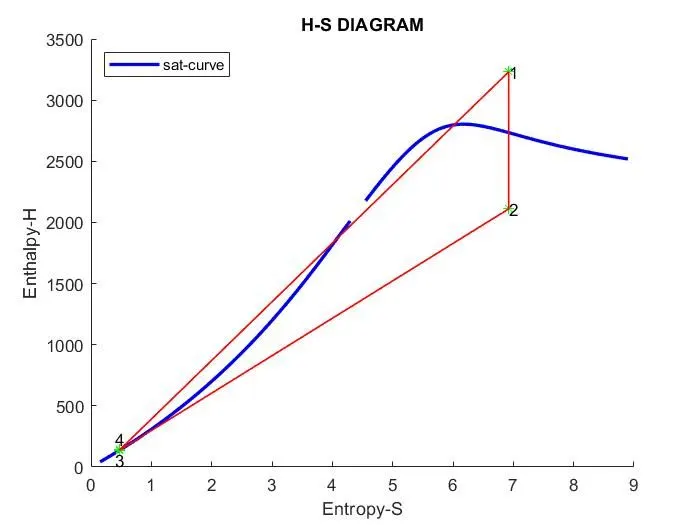
- Similarly plot the H-S diagram using the plot and text commands.
- x labels,y labels,title and legend commands are used to plot both the T-s and H-s diagram.
- Results are print in the command window using fprintf command for each state points.
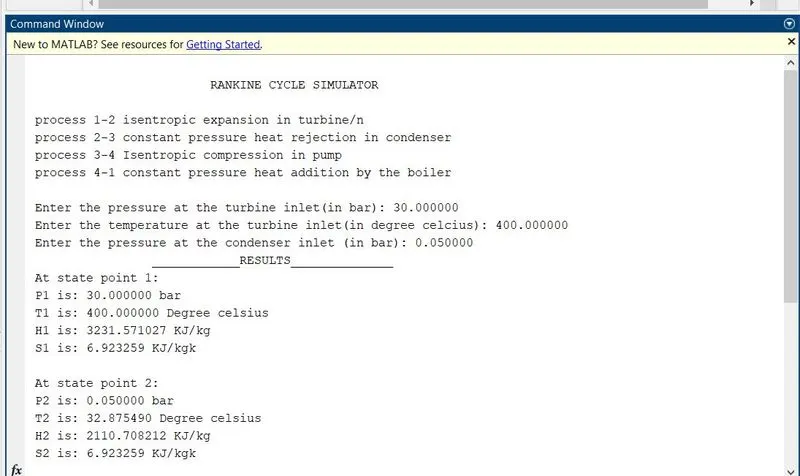
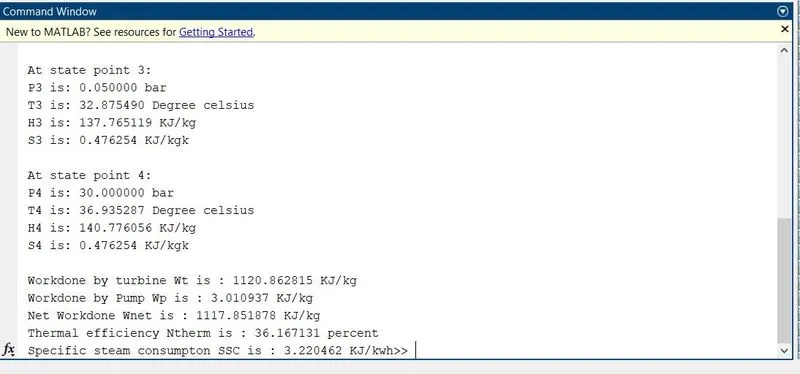
COMMAND WINDOW OUTPUT:
T-S DIAGRAM PLOT:
H-S DIAGRAM:
ERROR OCCURED WHILE CODING:
Didn't get the T-S diagram plotting
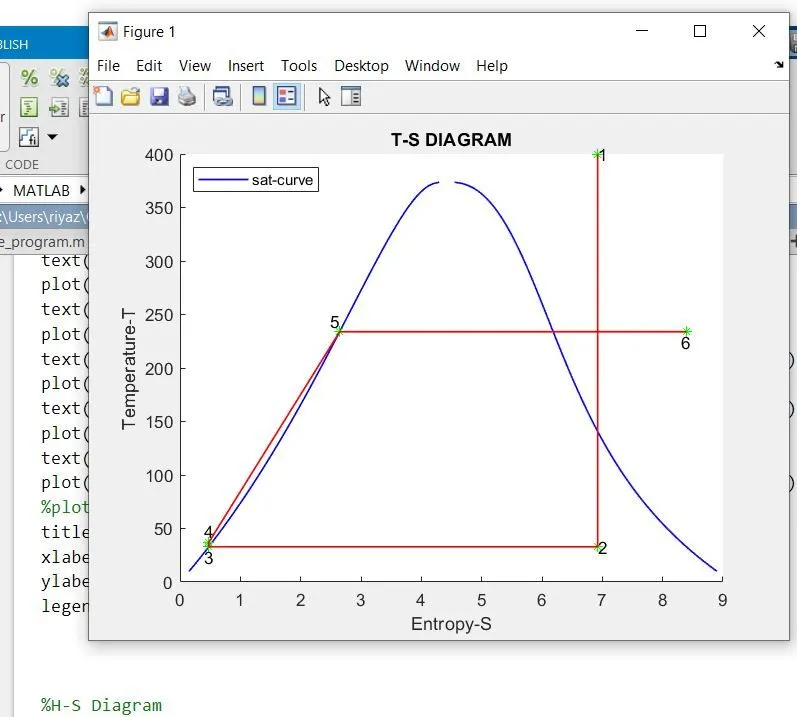
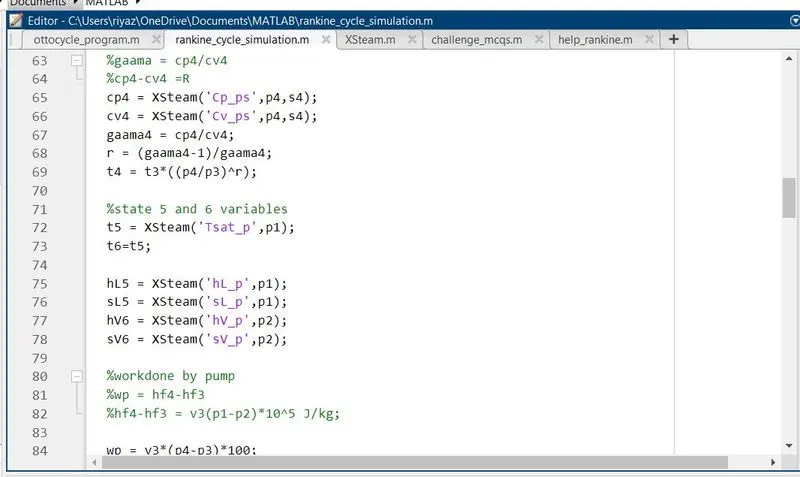
Given the condenser inlet pressure p2 instead of p1 ,for process 4-1 the pressure is boiler pressure p1,change the pressure variable p2 to p1 in line 77 and 78 to get the correct curve.
CONCLUSION:
Rankine cycle simulator is created by matlab program,all the state points are calculated and T-s and H-s diagram plots are plotted using matlab program and results are shown in command window.