Project - Data Handling and Interpolation
AIM-
Performing Interpolation of Data and Generating the Interactive Plots.
OBJECTIVE-
1.Reading the laboratory experimented data from the excel file
2.extracting the data and stired it in the variables
3.Interpolating the data.
4.compute the value of current from the given voltage data.
5.then storing the resulted data in the text file.
PROGRAM -
For linear and spline interpolation-
For linear interpolation using fine grid and cubic interpolation over fine grid -
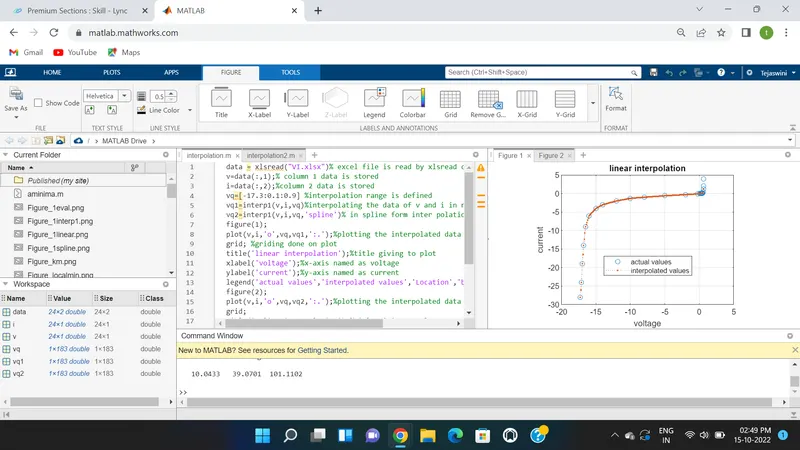
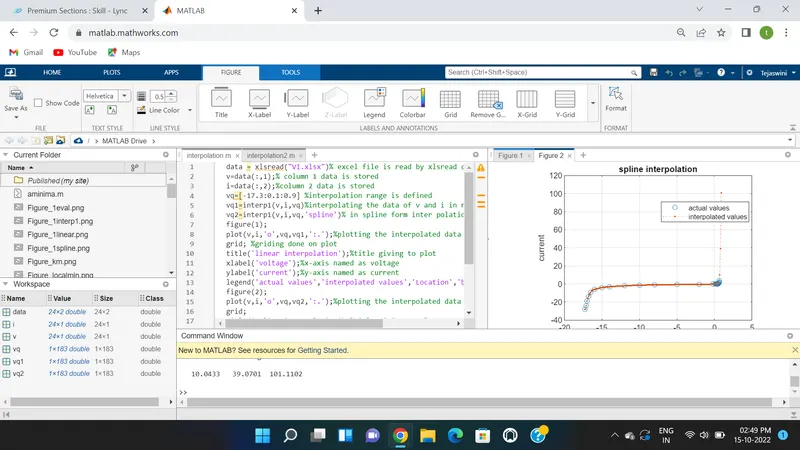
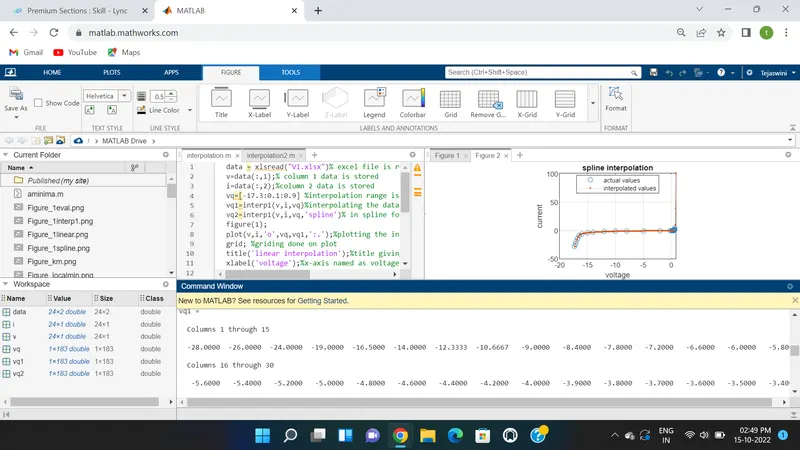
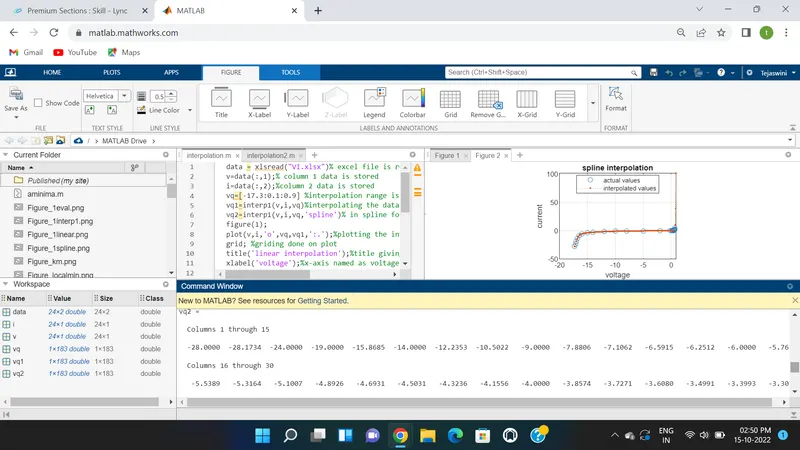
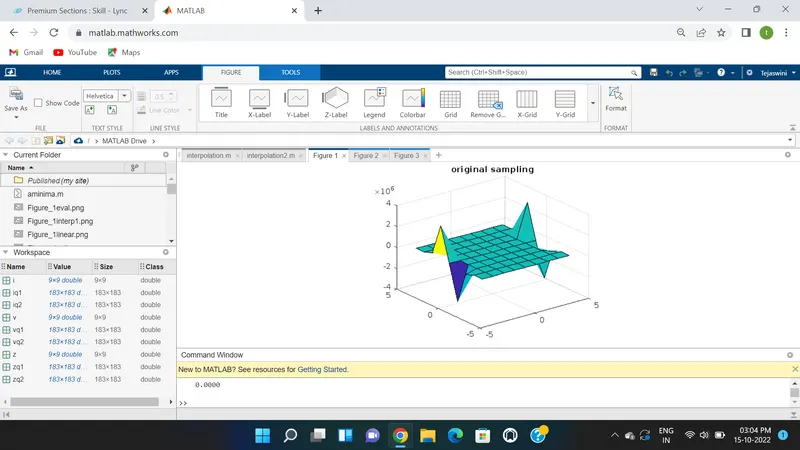
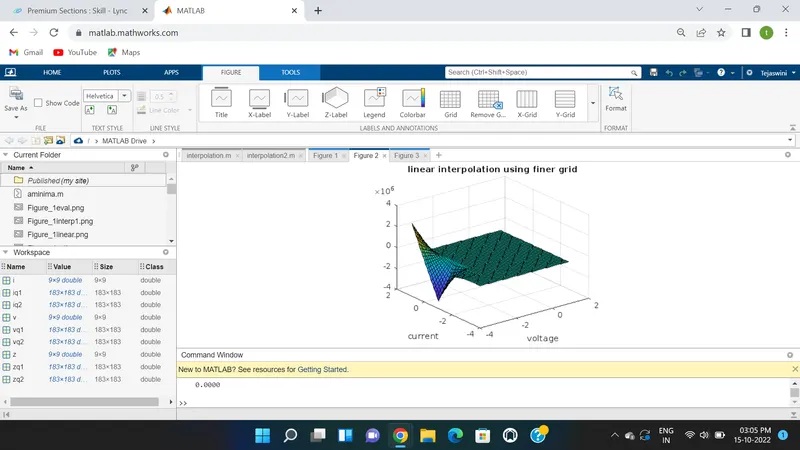
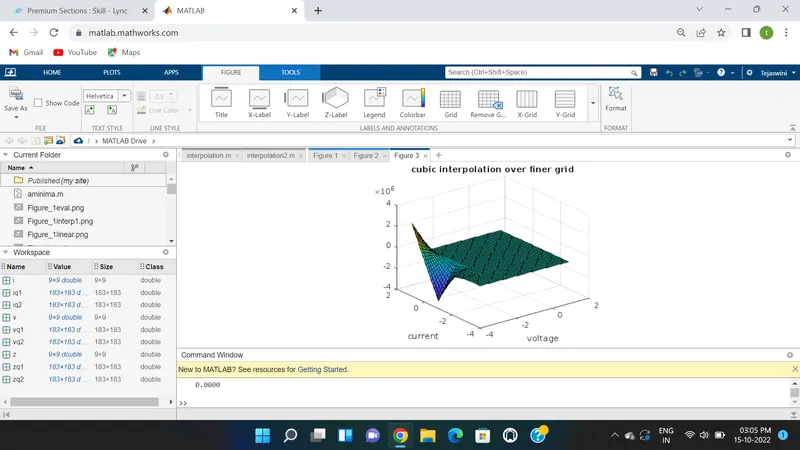
Plot of Original sampling ,linear interpolation using finer grid and linear interpolation over finer grid are shown below
EXPLANATION-
By using xlsread function data is read and stored in the variable named as data as shown in the program.
First column data which is voltage is stored in variable v and second column data of current is stored in i are seperated by giving the command(:,1) and (:,2) as shown in the program.
Then the interpolation range which is given in the question id stored in the vq after that linear interpolation is done by using the 'intrep1()' command by providing the v,i and vq(interpolating range).then spline interpolation is carried out using 'interp1()'s specifies the spline interpolation method
The linear interpolation is plotted using the figure(1) command and plot command and interpolated data is also drawn in this plot by using vq and vq1 then grid is done by using the grid command.
Then title is given to the plot by using title() command and labelling of x- axis and y-axis is done by using the command xlabel() and ylabel() .
Legends command is give to distinguish the actual values and interpolated values in the plot and the location is selected as 'best' in the program which give the legends according to the plot behaviour.
Then figure(2) gives the spline interpolation plot by using the plot command which shows the interpolated values after that labelling of x- axis and y-axis are done by xlabel() and y-label command . Also legends are provided by using the legends() command.
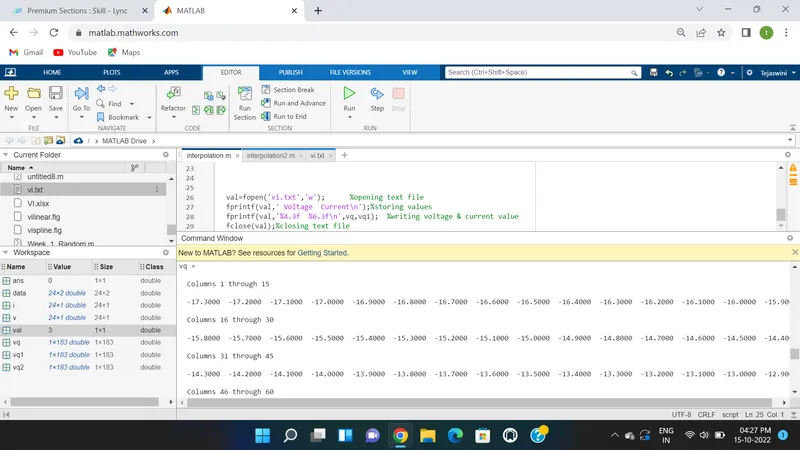
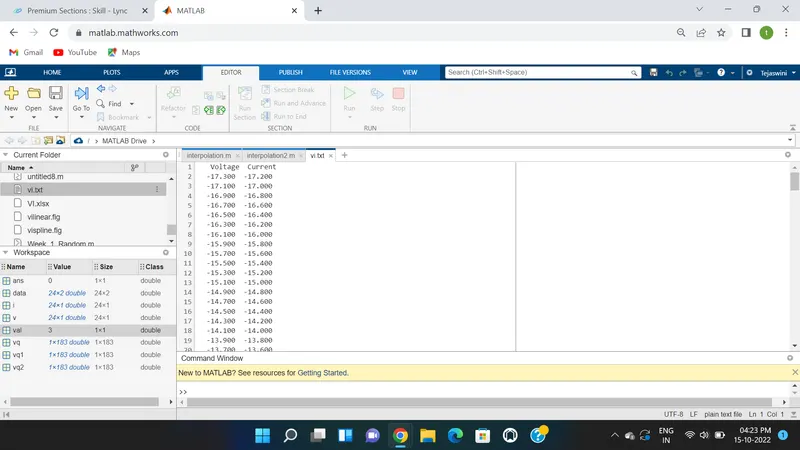
The txt file vi.txt is opened in write mode shown as 'w' by giving fopen()command.Then by using fprintf() command the interpolated values after performing spline interpolation is saved in text file.
For performing linear interpolation using finer grid and cubic interpolation over finer grid , meshgrid is created as shown in the program whose variables are v and i. Then z is the variable having exponential term.By using surf() plotting the graphs showing the v,i and z values .This plot named as 'original sampling' by using title() command
As mentioned range in the question , vq1 and iq1 assigned the values by meshgrid and interpolation done by interp2() command. zq1 gives the interpolated data of v,i,z ,vq and iq.Then graph is plotted showing v,i and interpolated values by using surf()command.
Figure (2) shows the plot of linear interpolation under finer grid and figure(3) shows the plot of cubic interpolation over finer grid.In cubic interpolation the program is same as performed in linear interpolation in finer grid but the variables are changed as vq2 and iq2.Title,labels and legends are given as shown in the program.
CONCLUSION -
In this project, we learned the interpolation of data within specified range and generating the interactive plots for the interpolated data.