Project - Data Handling and Interpolation
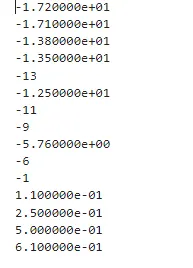
Aim- In a laboratory experiment, data of voltage and current has been recorded and the same is attached in an excel file. Read the excel file in the Matlab program and perform the interpolation in the range of -17.3:0.1:0.9. Generate the interactive plot for the interpolated data and store them in a text file.
A=xlsread('interpolation.xlsx','Sheet1')%read the data from excel sheet
v=A(:,1);
a=A(:,2);
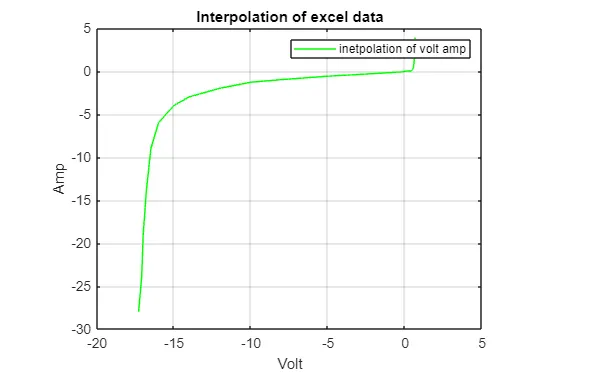
plot(v,a,'-g');grid;hold;
xlabel('Volt');ylabel('Amp');
legend('inetpolation of volt amp');
title('Interpolation of excel data');
V=interp1(v,a)
fileidl=fopen('interpolation.xlsx','r');
fileid=fopen('interpolation.txt','w');
VV =[-17.2 -17.1 -13.8 -13.5 -13.0 -12.5 -11 -9 -5.76 -6 -1 0.11 0.25 0.5 0.61];
Vvolt=-17.3:0.1:0.9;
A=interp1(VV,Vvolt);
fprintf(fileid,'%d\n',VV);
fclose(fileid);
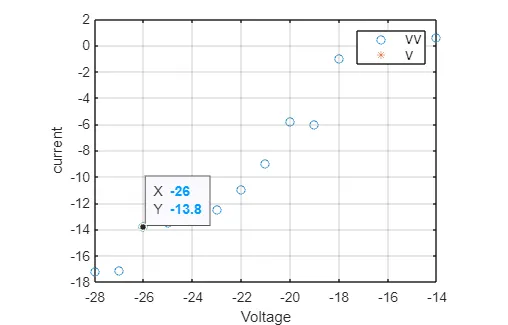
plot((-28:-14),VV,'o',Vvolt,A,'*');grid;
legend('VV','V');
xlabel('Voltage');ylabel('current');
output
%output oh text file