Project - Data Handling and Interpolation
question:
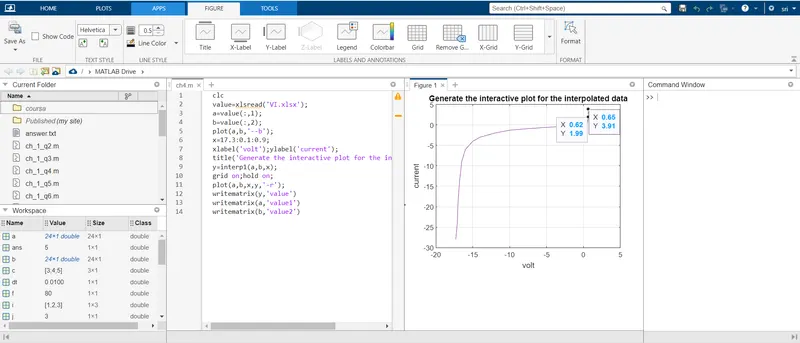
clc
value=xlsread('VI.xlsx'); %input from excel.
a=value(:,1);
b=value(:,2);
plot(a,b,'--b');%plot the given value
x=17.3:0.1:0.9;
xlabel('volt');ylabel('current');
title('Generate the interactive plot for the interpolated data');
y=interp1(a,b,x); %interpolation the data set
grid on;hold on;
plot(a,b,x,y,'-r');
writematrix(y,'value') %save txt file
writematrix(a,'value1')
writematrix(b,'value2')
output: