Project - Data Handling and Interpolation
Project :
In a laboratory experiment, data of voltage and current has been recorded and the same is attached in an excel file ( Click on this link VI.xlsx ). Read the excel file in the Matlab program and perform the interpolation in the range of -17.3:0.1:0.9. Generate the interactive plot for the interpolated data and store them in a text file.
Key Highlights:
- Graphical solutions are more visual and appealing
- Interpolation of data
- Read excel file
- Write to a text file
Deliverables:
- Find missing data and save it in text
- Interpolate the data set
- Save your program and attach the same.
- Save the text file and upload it in the attachment
SOL: -
MATLAB Script: -
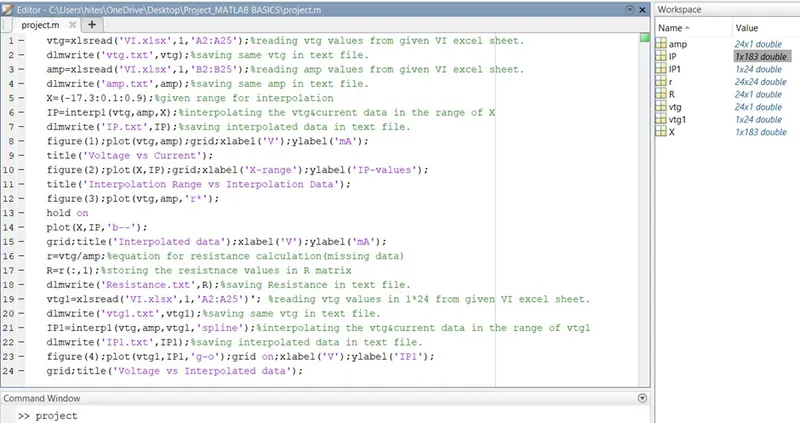
vtg=xlsread('VI.xlsx',1,'A2:A25');%reading vtg values from given VI excel sheet.
dlmwrite('vtg.txt',vtg);%saving same vtg in text file.
amp=xlsread('VI.xlsx',1,'B2:B25');%reading amp values from given VI excel sheet.
dlmwrite('amp.txt',amp);%saving same amp in text file.
X=(-17.3:0.1:0.9);%given range for interpolation
IP=interp1(vtg,amp,X);%interpolating the vtg¤t data in the range of X
dlmwrite('IP.txt',IP);%saving interpolated data in text file.
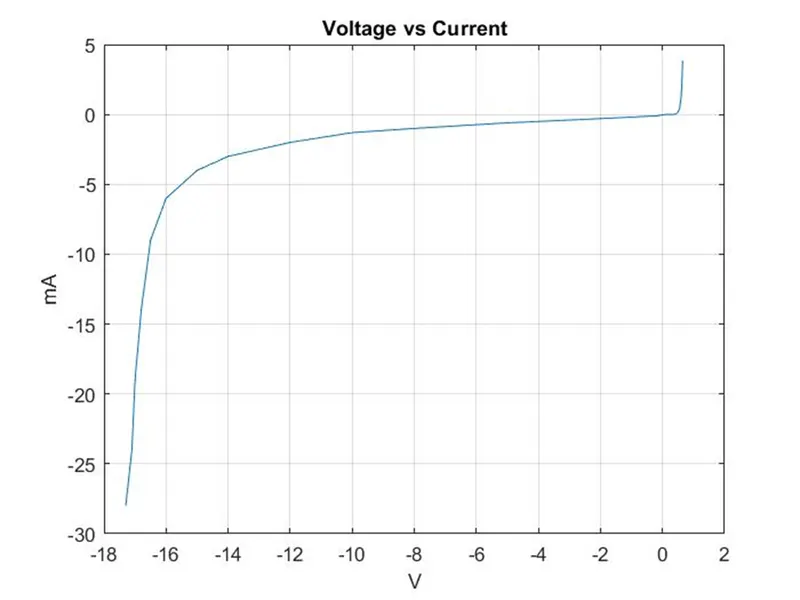
figure(1);plot(vtg,amp);grid;xlabel('V');ylabel('mA');
title('Voltage vs Current');
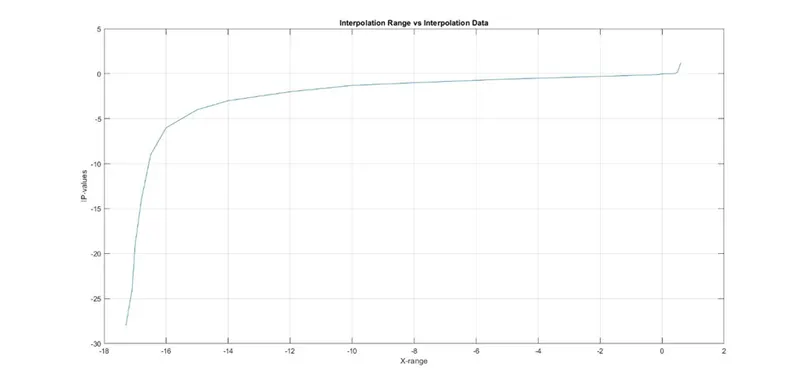
figure(2);plot(X,IP);grid;xlabel('X-range');ylabel('IP-values');
title('Interpolation Range vs Interpolation Data');
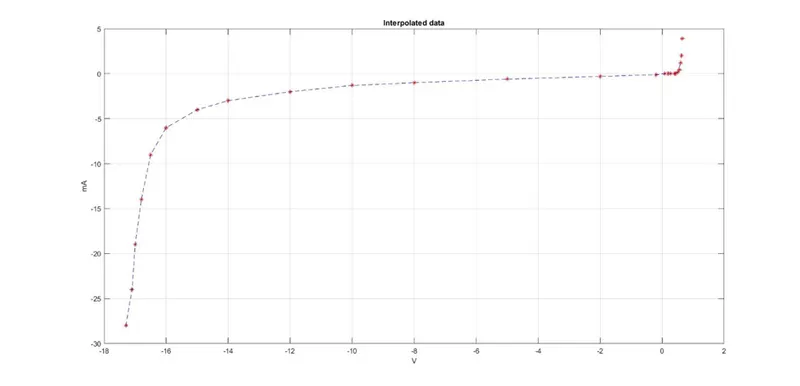
figure(3);plot(vtg,amp,'r*');
hold on
plot(X,IP,'b--');
grid;title('Interpolated data');xlabel('V');ylabel('mA');
r=vtg/amp;%equation for resistance calculation(missing data)
R=r(:,1);%storing the resistnace values in R matrix
dlmwrite('Resistance.txt',R);%saving Resistance in text file.
vtg1=xlsread('VI.xlsx',1,'A2:A25')'; %reading vtg values in 1*24 from given VI excel sheet.
dlmwrite('vtg1.txt',vtg1);%saving same vtg in text file.
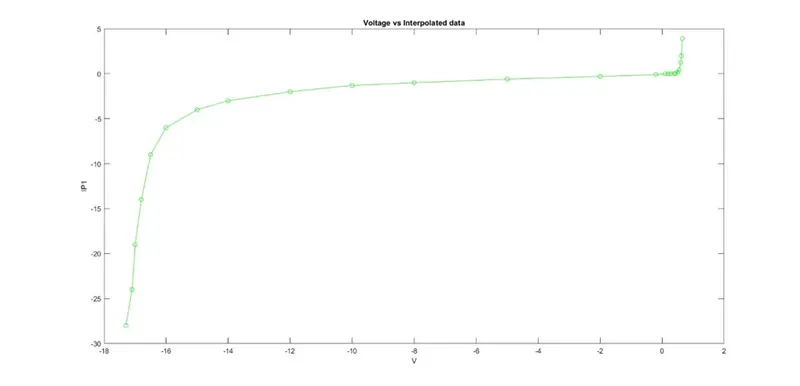
IP1=interp1(vtg,amp,vtg1,'spline');%interpolating the vtg¤t data in the range of vtg1
dlmwrite('IP1.txt',IP1);%saving interpolated data in text file.
figure(4);plot(vtg1,IP1,'g-o');grid;xlabel('V');ylabel('IP1');
grid;title('Voltage vs Interpolated data');
RESULTS