Project - Data Handling and Interpolation
Report -
Steps- 1) imported data from the excel file as column vectors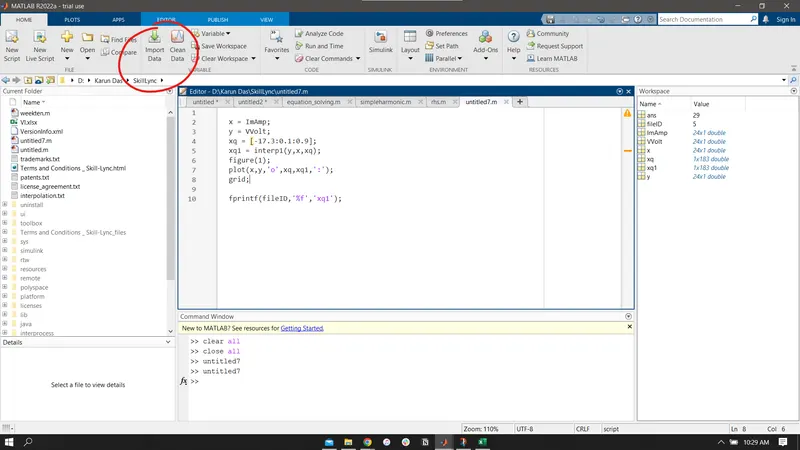
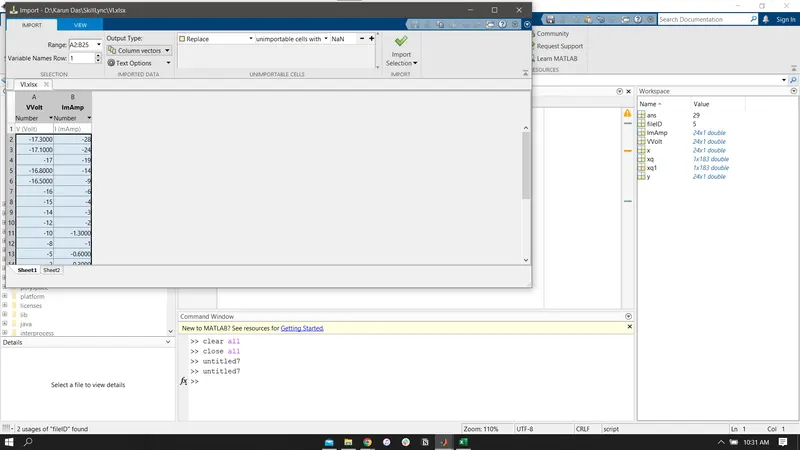
Main Code
fileID = fopen('interpolation.txt','w');
x = ImAmp;
y = VVolt;
xq = [-17.3:0.1:0.9];
xq1 = interp1(y,x,xq);
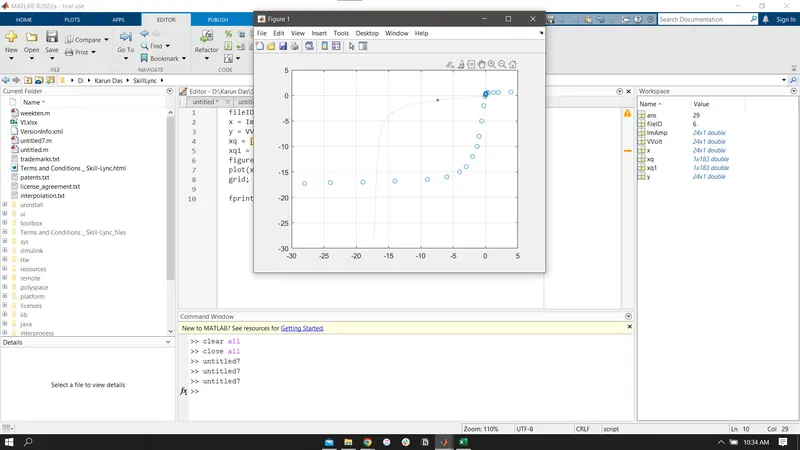
figure(1);
plot(x,y,'o',xq,xq1,':');
grid;

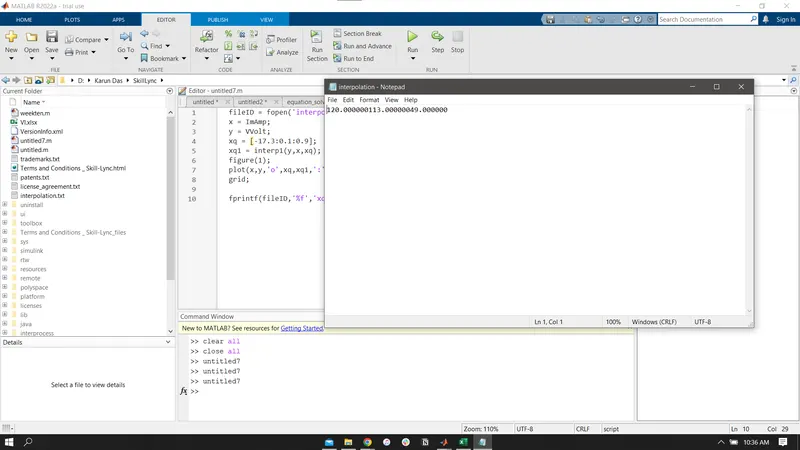
fprintf(fileID,'%f','xq1'); 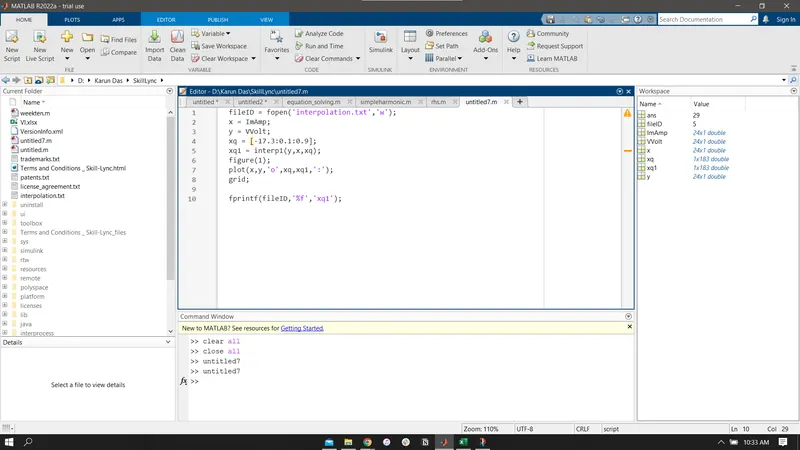
Output