Project - Data Handling and Interpolation
PROJECT :DATA HANDLING AND INTERPOLATION
Aim: Handle the given data and interpolate the current value for given range of voltage. Interpolate by using the given experimental data to find the relative current for the range of voltage from -17.3V to 0.9V. Write the data on to text file ('Output.txt')
Steps:
- Read the data by taking all the data into the workspace.
- Assign the Variable for the Voltage and Current of experimental data. Load the values respectively.
- Define the reference Voltage value by the given range from -17.3 to 0.9 V with difference of 0.1V.
- Find the Corresponding Current value that are not given in the experimental data by interpolating the given experimental data and fing the Current values that are corresponding to the given range of Voltage using SPLINE Interpolation for better fitting to the experimental data.
- For comparison plot the both experimental graph and interpolated graph.
- As per the requirement given Load the data into the text file Output.txt.
Program:
clc;clear;
%% Reading the data from the Given excel file VI.xlsx

data = readtable("VI.xlsx");

% Loading the data into the variable.

V = table2array(data(:,1));
I = table2array(data(:,2));

%% Interpolation
% Setting the Voltage range from -17.30 to 0.9 V

Voltage = (-17.3:0.1:0.9)';

% Used from x and y axis plot.

y = zeros(length(V),1);
x = zeros(length(I),1);

% Interpolating the Current value using given current and Voltage for
% respective Voltage value in the range

Current=interp1(V,I,Voltage,'spline');
Out = [Voltage,Current];

%% Ploting the data on the sheet
% Plot using the given data

figure(1);
subplot(2,1,1);
plot(V,I,'r',V,y,'--k',x,I,'--k');
hold on;
grid on;
xlabel('Voltage');
ylabel('Current');
title('Given Experimental Data');
subplot(2,1,2);
% Plot the interpolated data.

y = zeros(length(Voltage),1);
x = zeros(length(Voltage),1);
plot(Voltage,Current,'r',Voltage,y,'--k',x,Current,'--k');
xlabel('Voltage');
ylabel('Current');
title('Interpolated Data');
grid on;
hold off;

%% Writing on to the test file Output.txt

% Writing the given experimental data

fid=fopen("Output.txt","w+");
fprintf(fid,'Given values\n\t%6s \t %6s\n','Voltage','Current');
for i=1:1:length(V)
    fprintf(fid,' %10.2f \t %6.4f\n',V(i),I(i));
end
fprintf(fid,'\n\n');
% Writing the Interpolated data on to the Output.txt file

fprintf(fid,'Interpolated values\n\t%6s \t %6s\n','Voltage','Current');
for i=1:1:length(Voltage)
    fprintf(fid,' %10.2f \t %6.4f\n',Out(i,:));
end
% Closing the file opened.

fclose(fid);
Graph:
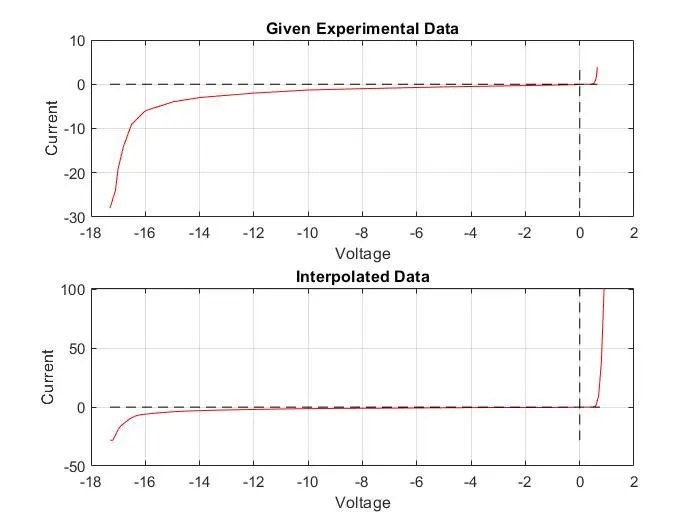
Result:
The above data is perfectly interpolated for the range of voltage and along with missing values are written into the text file. Script file, text file are attached.