Project - Data Handling and Interpolation
DATA HANDLING AND INTERPOLATION
A PROJECT
OBJECTIVE
To design and develop the appropriate MATLAB programmes for getting and handling the data from the supplied Excel file.
AIM
Utilize the accompanying voltage and current data from an Excel file as an input to a MATLAB program to interpolate the data inside the specified range. To overcome the hurdles, you must confront, create an interactive display that displays the interpolated data.
INTERPOLATION
Interpolation is a method for incorporating new data points between known data points in a range. To fill in gaps in data, smooth out existing data, create forecasts, and more, utilise interpolation. The two types of interpolation in MATLAB are for dispersed data points and data points on a grid.
GIVEN VOLTAGE (V) AND CURRENT (I)
|
V (Volt) |
I (mAmp) |
|
-17.3 |
-28 |
|
-17.1 |
-24 |
|
-17 |
-19 |
|
-16.8 |
-14 |
|
-16.5 |
-9 |
|
-16 |
-6 |
|
-15 |
-4 |
|
-14 |
-3 |
|
-12 |
-2 |
|
-10 |
-1.3 |
|
-8 |
-1 |
|
-5 |
-0.6 |
|
-2 |
-0.3 |
|
-0.2 |
-0.1 |
|
0.09 |
0 |
|
0.19 |
0 |
|
0.27 |
0 |
|
0.39 |
0.01 |
|
0.43 |
0.03 |
|
0.5 |
0.17 |
|
0.55 |
0.42 |
|
0.6 |
1.23 |
|
0.62 |
1.99 |
|
0.65 |
3.91 |
MATLAB PROGRAM
MATLAB CODE DEFINITION
STEP - 1
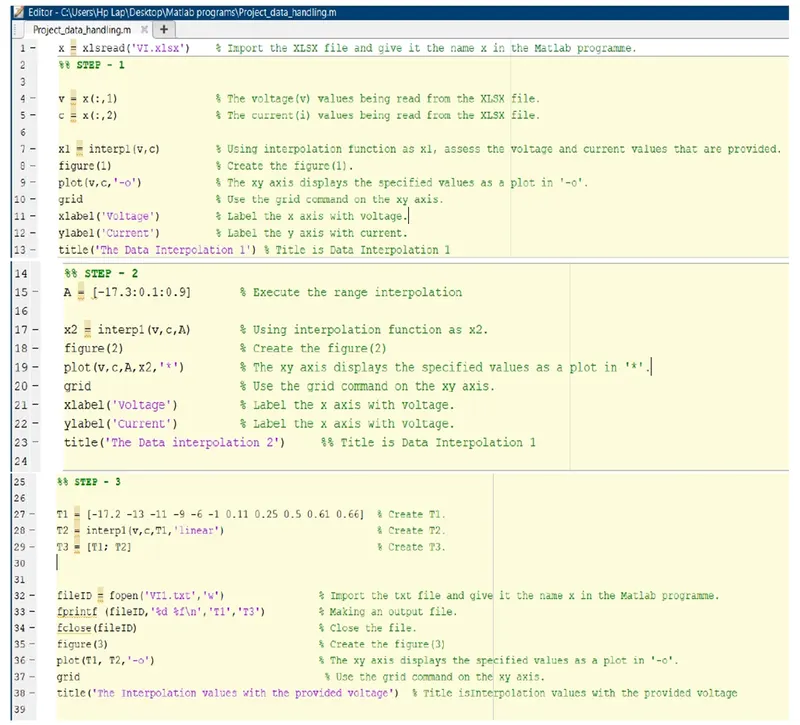
- x = xlsread('VI.xlsx')
Import the XLSX file and give it the name x in the Matlab programme.
- v = x(:,1)
The voltage(v) values being read from the XLSX file.
- c = x(:,2)
The current(i) values being read from the XLSX file.
- x1 = interp1(v,c)
Using interpolation function as x1, assess the voltage and current values that are provided.
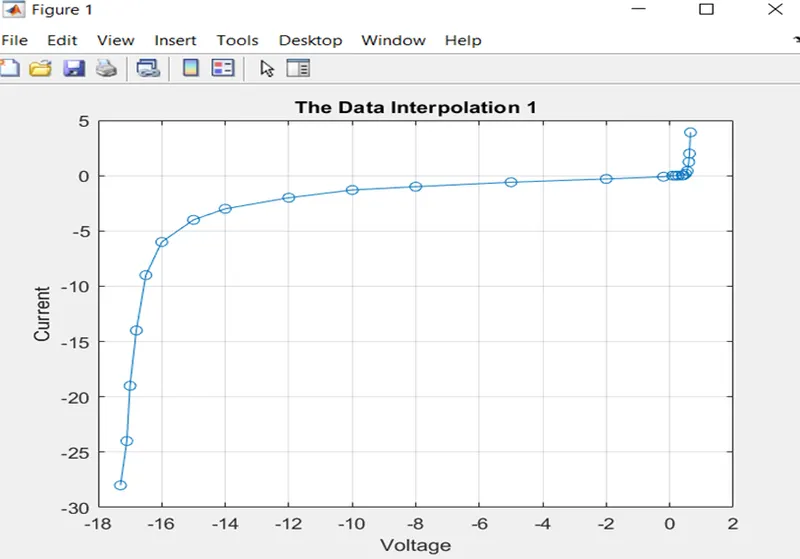
- figure (1)
Create the figure(1).
- plot(v,c,'-o')
The xy axis displays the specified values as a plot in '-o'.
- Grid
Use the grid command on the xy axis.
- xlabel('Voltage')
Label the x axis with voltage.
- ylabel('Current')
Label the y axis with current.
- title ('The Data Interpolation 1')
Title is Data Interpolation 1
FIGURE (1)
MATLAB CODE DEFINITION
STEP - 2
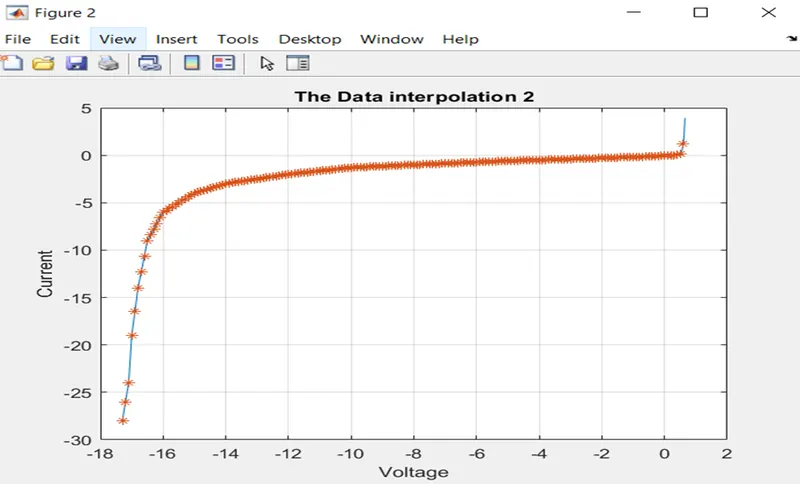
- A = [-17.3:0.1:0.9]
Execute the range interpolation
- x2 = interp1(v,c,A)
Using interpolation function as x2.
- figure(2)
Create the figure(2)
- plot(v,c,A,x2,'*')
The xy axis displays the specified values as a plot in '*'.
- grid
Use the grid command on the xy axis.
- xlabel('Voltage')
Label the x axis with voltage.
- ylabel('Current')
Label the x axis with voltage.
- title('The Data interpolation 2')
Title is Data Interpolation 1
FIGURE (2)
MATLAB CODE DEFINITION
STEP – 3
- T1 = [-17.2 -13 -11 -9 -6 -1 0.11 0.25 0.5 0.61 0.66]
Create T1
- T2 = interp1(v,c,T1,'linear')
Create T2.
- T3 = [T1; T2]
Create T3.
- fileID = fopen('VI1.txt','w')
Import the txt file and give it the name x in the Matlab programme.
- fprintf (fileID,'%d %f\n','T1','T3')
Making an output file.
- fclose(fileID)
Close the file.
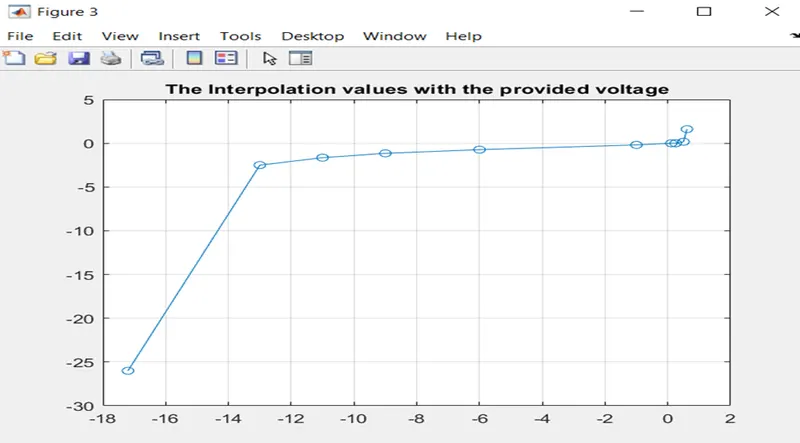
- figure(3)
Create the figure(3)
- plot(T1, T2,'-o')
The xy axis displays the specified values as a plot in '-o'.
- grid
Use the grid command on the xy axis.
- title('The Interpolation values with the provided voltage') %
Title isInterpolation values with the provided voltage
FIGURE (3)