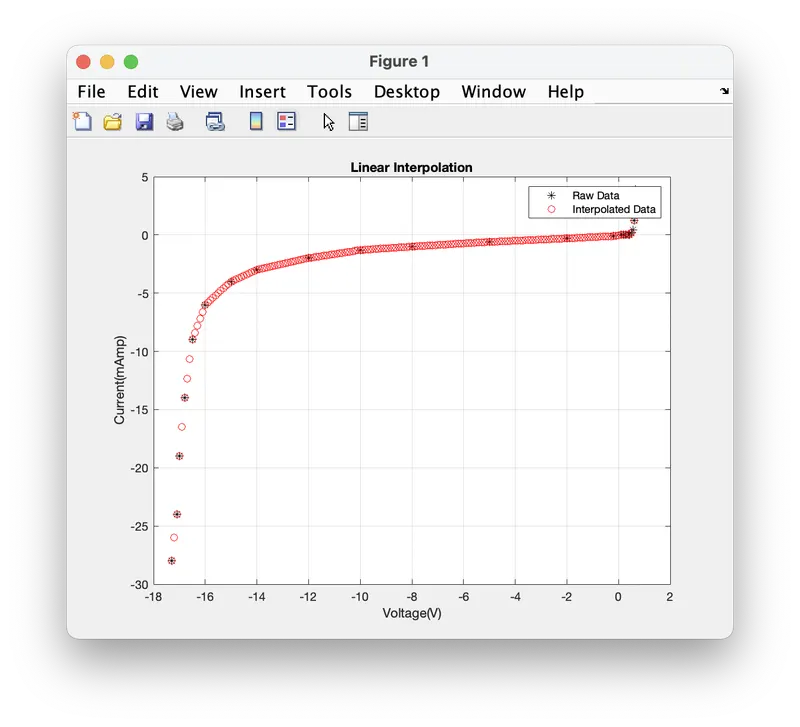
Project - Data Handling and Interpolation
Program#1:
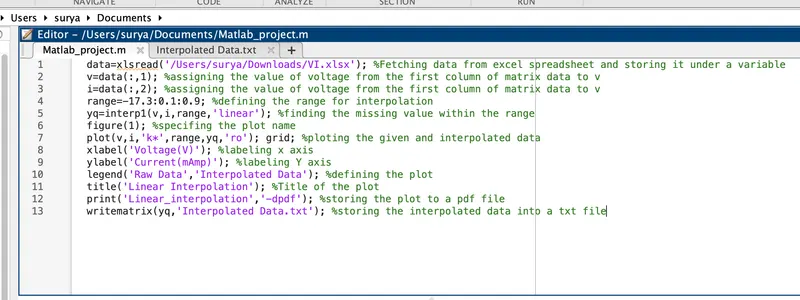
data=xlsread('/Users/surya/Downloads/VI.xlsx'); %Fetching data from excel spreadsheet and storing it under a variable
v=data(:,1); %assigning the value of voltage from the first column of matrix data to v
i=data(:,2); %assigning the value of voltage from the first column of matrix data to v
range=-17.3:0.1:0.9; %defining the range for interpolation
yq=interp1(v,i,range,'linear'); %finding the missing value within the range
figure(1); %specifing the plot name
plot(v,i,'k*',range,yq,'ro'); grid; %ploting the given and interpolated data
xlabel('Voltage(V)'); %labeling x axis
ylabel('Current(mAmp)'); %labeling Y axis
legend('Raw Data','Interpolated Data'); %defining the plot
title('Linear Interpolation'); %Title of the plot
print('Linear_interpolation','-dpdf'); %storing the plot to a pdf file
writematrix(yq,'Interpolated Data.txt'); %storing the interpolated data into a txt file
Output: