Project - Data Handling and Interpolation
PROJECT :
% laboratory experiment, Generate the interactive plot for the interpolated data.
matrix = xlsread ('VI.xlsx'); % to read the VI excel file
V = matrix (:,1); % 1st column all row values save in V
I = matrix (:,2); % 2nd column all row values save in I
figure(1);
plot (V,I); % ploting given voltage and current in figure 1
xlabel('voltage'); ylabel('current');
title ('Recorded data');
X = [-17.3: 0.1: 0.9]; % from question interpolating range
Y = interp1(V,I,X,'spline'); % finding interpolated data
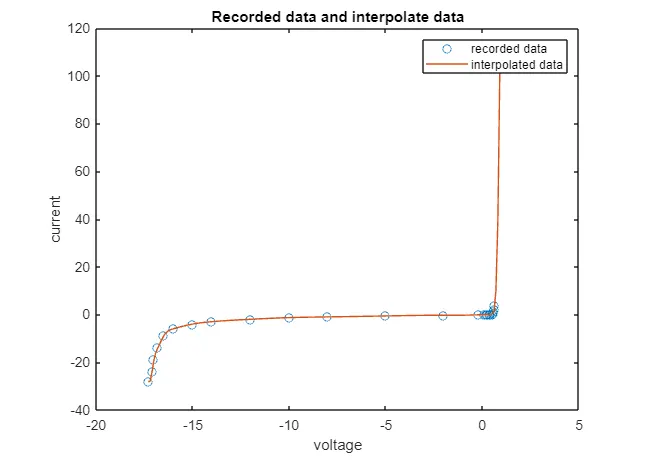
figure(2);
plot (V,I,'o',X,Y); % ploting recording data and interpolating data
title ('Recorded data and interpolate data');
xlabel('voltage'); ylabel('current');
legend('recorded data','interpolated data')
inter_value = [X ; Y];
fid = fopen('inter_value.txt','w'); % to save in text file. w use to write file
fprintf (fid,'%2f3 %2f3\n',inter_value);
fclose(fid);
OUTPUT:
figure 1:
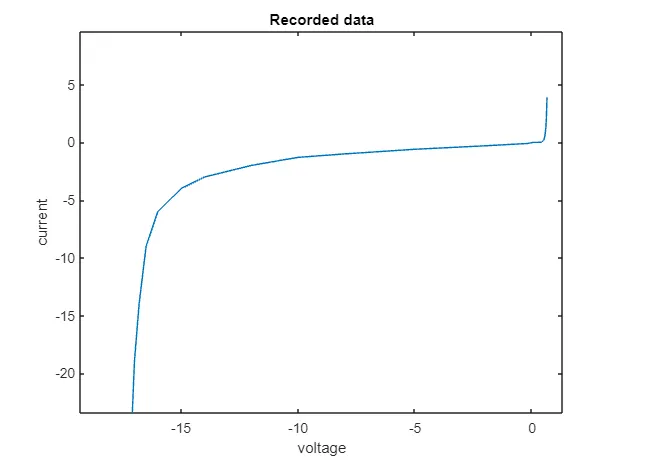
figure 2:
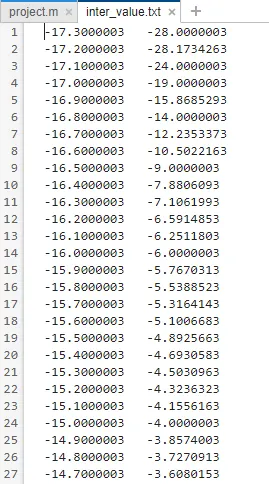
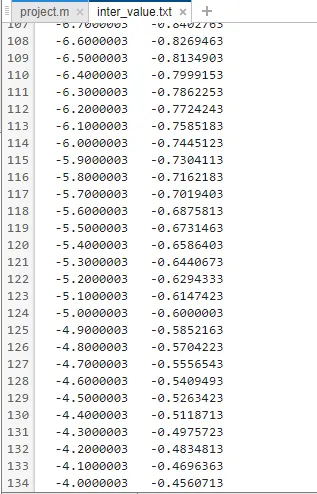
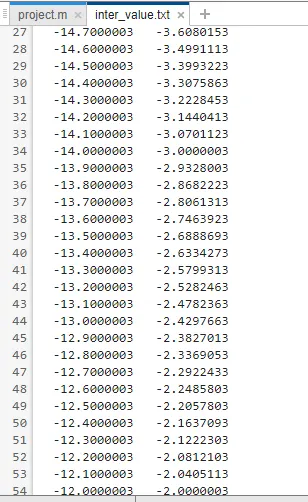
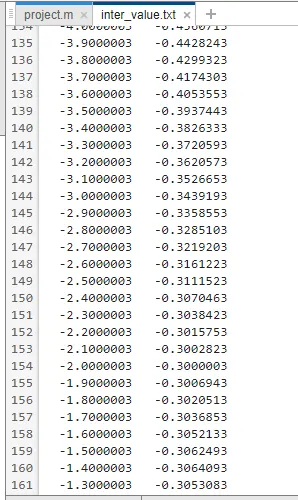
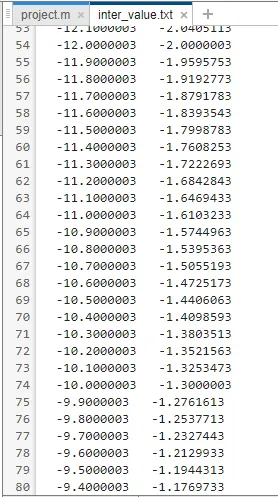
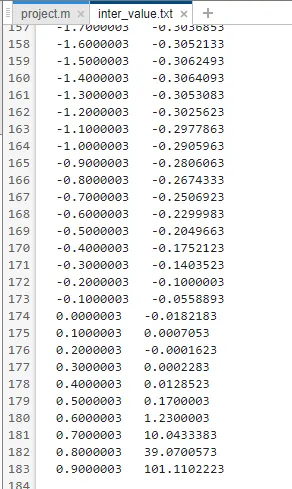
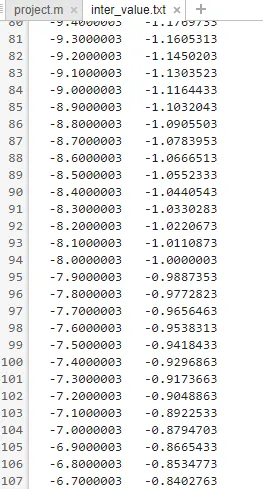
OUTPUT TEXT FILE:
(I did project in online matlab so cant attached text output file so i send screen shoot of the interpolated voltage and current value)