Project - Data Handling and Interpolation
PROJECT
DATA HANDLING AND INTERPOLATION
Project :
In a laboratory experiment, data of voltage and current has been recorded and the same is attached in an excel file ( Click on this link VI.xlsx ). Read the excel file in the Matlab program and perform the interpolation in the range of -17.3:0.1:0.9. Generate the interactive plot for the interpolated data and store them in a text file.
Key Highlights:
- Graphical solutions are more visual and appealing
- Interpolation of data
- Read excel file
- Write to text file
Deliverables:
- Find missing data and save it in text
- Interpolate the data set
- Save your program and attach the same.
- Save txt file and upload in attachment
Ans:
Interpolation:
The key matlab functions to help with interpolation are: inter1 and inter2
In engineering applications, we run into situations where some X-Y data migh not be available. In those situations, one can use interpolation to determine the ‘Y’ values corresponding to a specific set of 'X' values
The interpolation options include: linear, cubic & spline among the others.
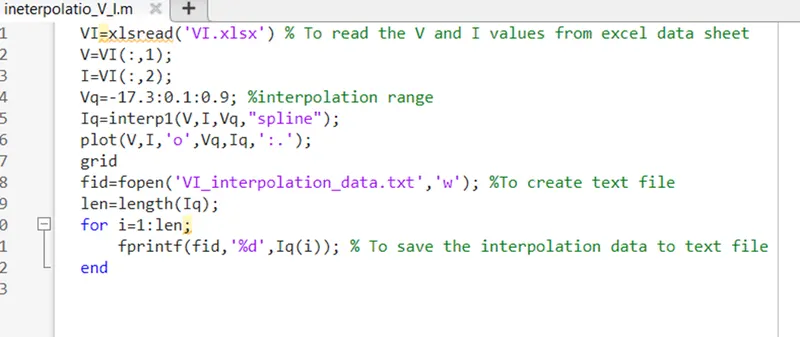
Matlab script for interpolate the data by using given voltage and current values to perform interpolation in the range of -17.3:0.1:0.9 is shown below.
VI=xlsread('VI.xlsx') % To read the V and I values from excel data sheet
V=VI(:,1);
I=VI(:,2);
Vq=-17.3:0.1:0.9; %interpolation range
Iq=interp1(V,I,Vq,"spline");
plot(V,I,'o',Vq,Iq,':.');
grid
fid=fopen('VI_interpolation_data.txt','w'); %To create text file
len=length(Iq);
for i=1:len;
fprintf(fid,'%d',Iq(i)); % To save the interpolation data to text file
end
Plot of interpolation data:
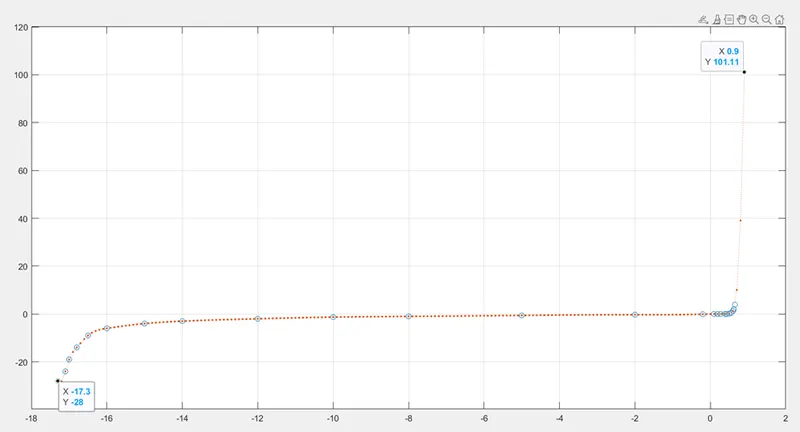
In the above plot dot line showing the interpolation data from -17.3 to 0.9 at voltage -17.3 the current is -28mA and at voltage 0.9 the current is 101.22 mA. The circles are showing given data of voltage and current values.