Project - Data Handling and Interpolation
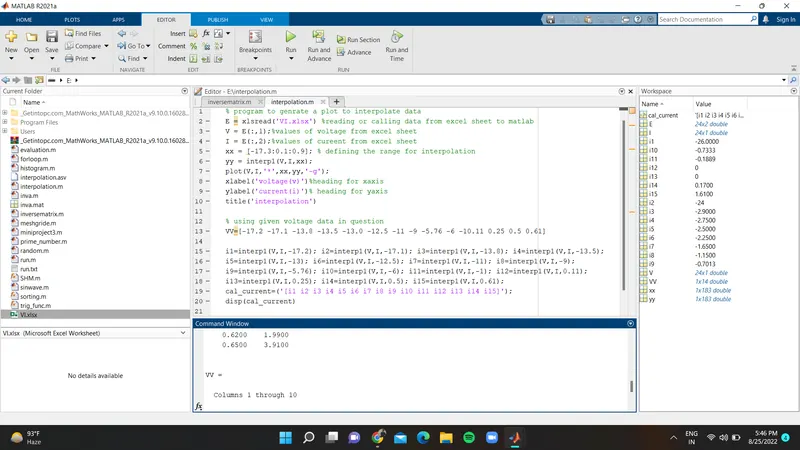
% program to genrate a plot to interpolate data
E = xlsread('VI.xlsx') %reading or calling data from excel sheet to matlab
V = E(:,1);%values of voltage from excel sheet
I = E(:,2);%values of cureent from excel sheet
xx = [-17.3:0.1:0.9]; % defining the range for interpolation
yy = interp1(V,I,xx);
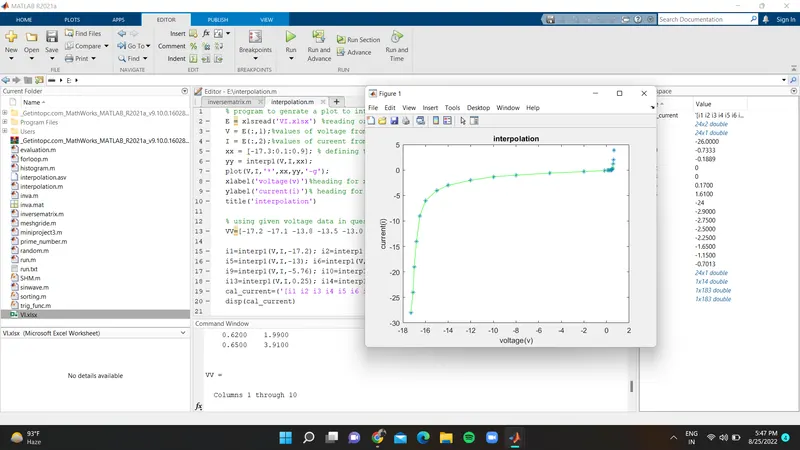
plot(V,I,'*',xx,yy,'-g');
xlabel('voltage(v)')%heading for xaxis
ylabel('current(i)')% heading for yaxis
title('interpolation')
% using given voltage data in question
VV=[-17.2 -17.1 -13.8 -13.5 -13.0 -12.5 -11 -9 -5.76 -6 -10.11 0.25 0.5 0.61]
i1=interp1(V,I,-17.2); i2=interp1(V,I,-17.1); i3=interp1(V,I,-13.8); i4=interp1(V,I,-13.5);
i5=interp1(V,I,-13); i6=interp1(V,I,-12.5); i7=interp1(V,I,-11); i8=interp1(V,I,-9);
i9=interp1(V,I,-5.76); i10=interp1(V,I,-6); i11=interp1(V,I,-1); i12=interp1(V,I,0.11);
i13=interp1(V,I,0.25); i14=interp1(V,I,0.5); i15=interp1(V,I,0.61);
cal_current=('[i1 i2 i3 i4 i5 i6 i7 i8 i9 i10 i11 i12 i13 i14 i15]');
disp(cal_current)
after that the values of current (I1,I2,I3......example)that we have received that can be seen in workspace can be converted to text file and can be called again