Project - Data Handling and Interpolation
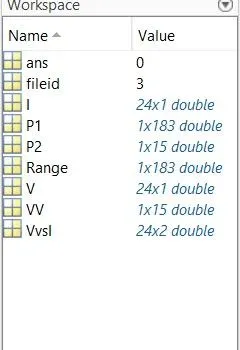
VvsI = xlsread("C:\Users\prath\Downloads\VI.xlsx"); %The xlsread command is used to store the data in the spreadsheet
V = VvsI(:,1);
I = VvsI(:,2);
Range = -17.3:0.1:0.9;
P1 = interp1(V,I,Range,'linear'); %The interpoliation command is used
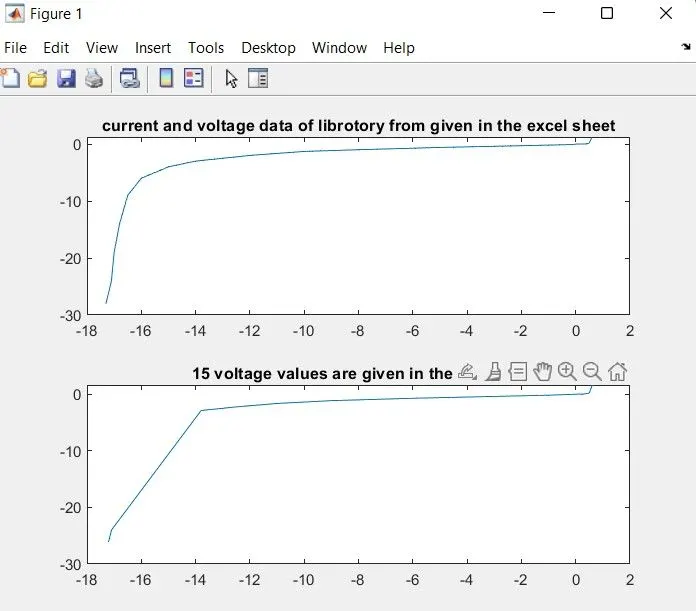
subplot(211); plot(Range,P1);
title('current and voltage data of librotory from given in the excel sheet');
VV =[-17.2 -17.1 -13.8 -13.5 -13.0 -12.5 -11 -9 -5.76 -6 -1 0.11 0.25 0.5 0.61];
P2 = interp1(V,I,VV,'linear');
subplot(212); plot(VV,P2);
title('15 voltage values are given in the question');
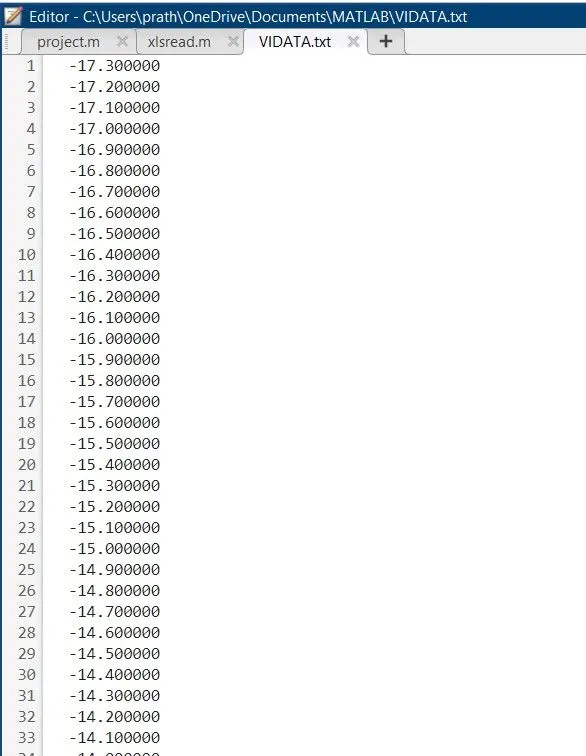
fileid = fopen('VIDATA.txt','w'); % Fopen is used to open the file
fprintf(fileid,'%f\n',Range); %Fprintf is used to display results on the screen
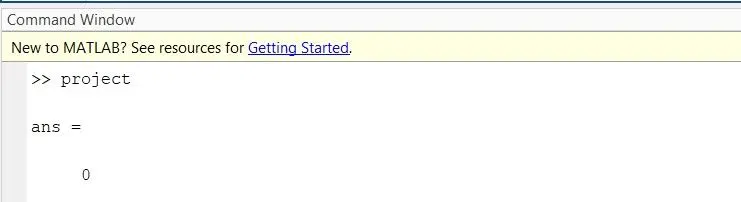
fclose(fileid)