Project
Objective:
- To carry out a system-level simulation of all-terrain vehicle and to prepre a technical report explaining the model properties.
About the Model:
- The model is developed to know about the BAJA all terrain vehicle CVT (Continious VAriable Transmission) system and to determine its performance under various conditions.
Model and Substem:
Engine:
- The model uses Generic Engine block from simscape library.The Generic Engine block represents a general internal combustion engine.
- This block is a suitable generic engine for spark-ignition and diesel.
- Speed-power and speed-torque parameterizations are provided.
- A throttle physical signal input specifies the normalized engine torque.
- Optional dynamic parameters include crankshaft inertia and response time lag.
- A physical signal port outputs the engine fuel consumption rate based on the fuel consumption model that you choose. Optional speed and redline controllers prevent engine stall and enable cruise control.
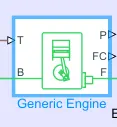
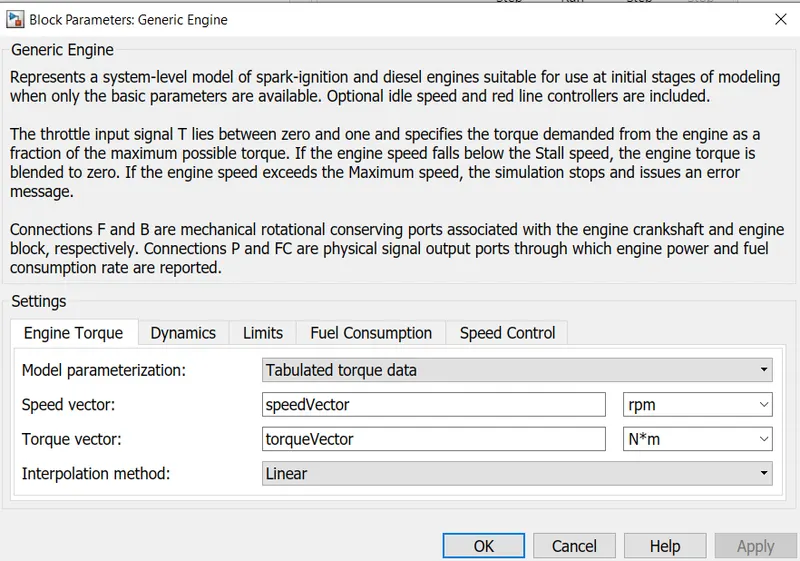
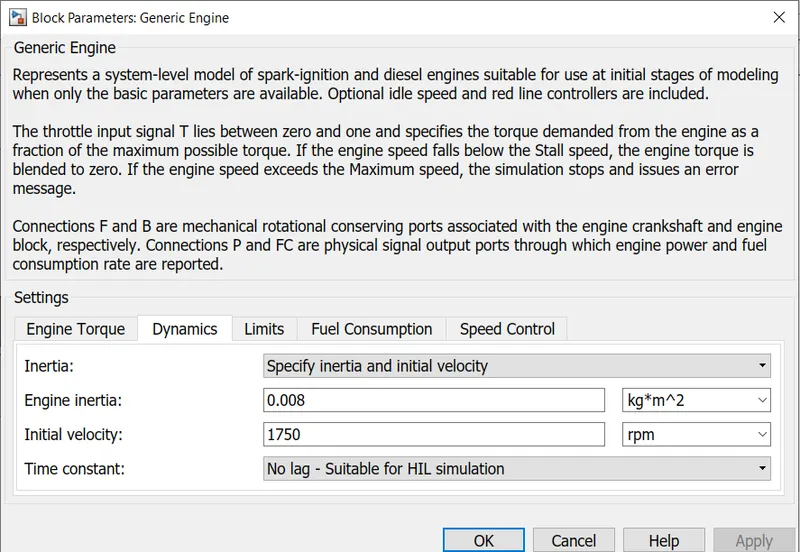
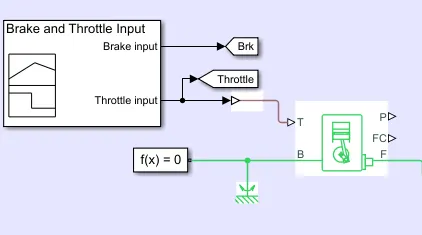
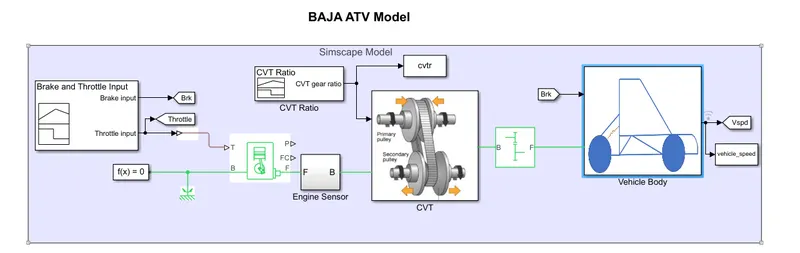
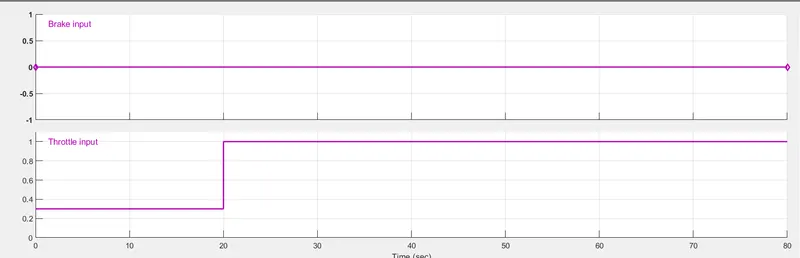
- The throttle input is given to this block with the help of signal builder block and the same signal builder block is used for the modelling the Brake command.Port B is the engine casing and Port F is for engine crankshaft.
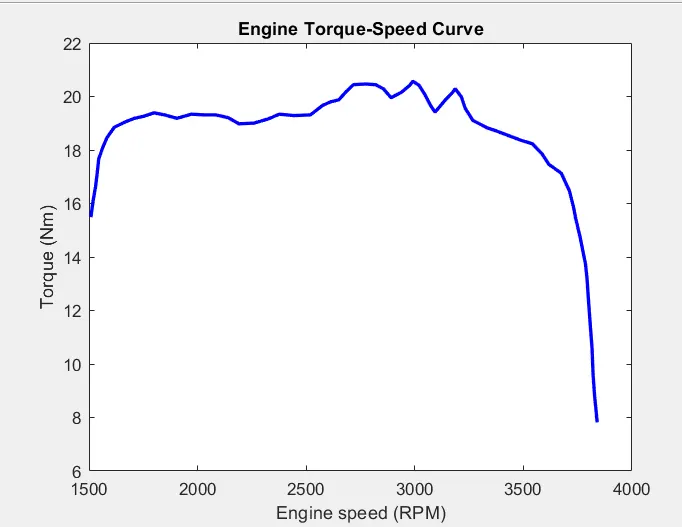
- The speed and torque vector are modelled with the help of torque speed characteristics of BAJA ATV model.
Transmission Subsystem:
CVT Model:
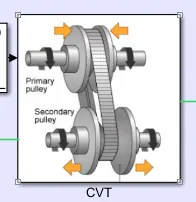
- A continuously variable transmission (CVT) is an automatic transmission that can change seamlessly through a continuous range of gear ratios. This contrasts with other transmissions that provide a limited number of gear ratios in fixed steps. The flexibility of a CVT with suitable control may allow the engine to operate at a constant RPM while the vehicle moves at varying speeds.
- The most common type of CVT uses two pulleys connected by a belt or chain; however, several other designs have also been used at times.
- The CVT gearbox, like other types of gearboxes, transmits torque and rotational speed from the driving end to driven end. In the pulley-based CVT, the torque transmission is done via a “V-Belt” from a “driving pulley” to a “driven pulley”.
- Each of the “driving” and “driven” pulleys is made up of two halves, and the halves can be pushed in or out. If the halves of the pulleys are pushed out, then the “V belt” running over it will go down and the effective diameter will reduce.
-
You already know that if the effective diameter of the “driving pulley” gets reduced, then the speed of the “driven pulley” will also reduce proportionately, and vice versa. Also, remember that as the speed of the driven pulley goes down the torque carrying capacity goes up, or in lower RPM the “driven pulley” will be able to handle a higher torque requirement.
-
Now see the picture below where the two halves of the “driving pulley” coming closer and the halves of the driven pulley are drawing away.
- From the picture you can see that the “V belt” is running around the periphery area of the “driving pulley” and is running around the centre area of the “driven pulley,” and that is how the effective diameter of the “driving pulley” got increased and that of the “driven pulley” got decreased. And from the gear and pulley drive basics, you can say that in this situation the speed of the “driven pulley” will increase and the torque carrying capacity will decrease.
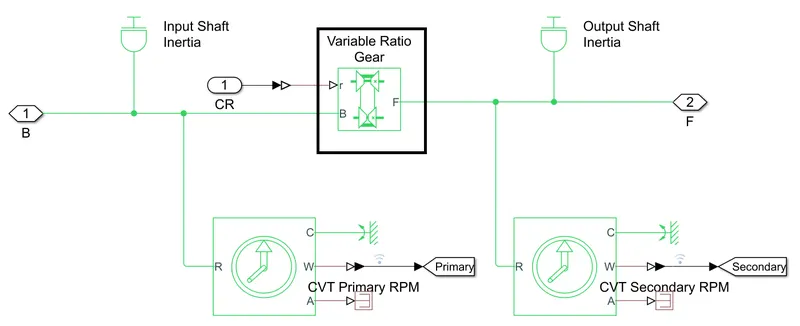
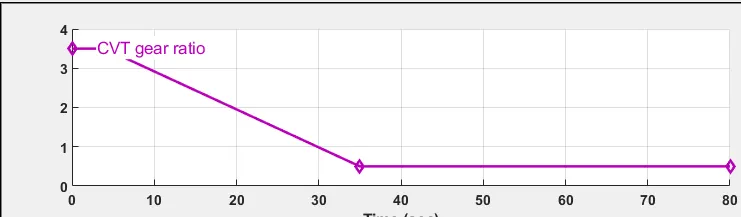
- The input to the Variable gear ratio is given via signal builder block.
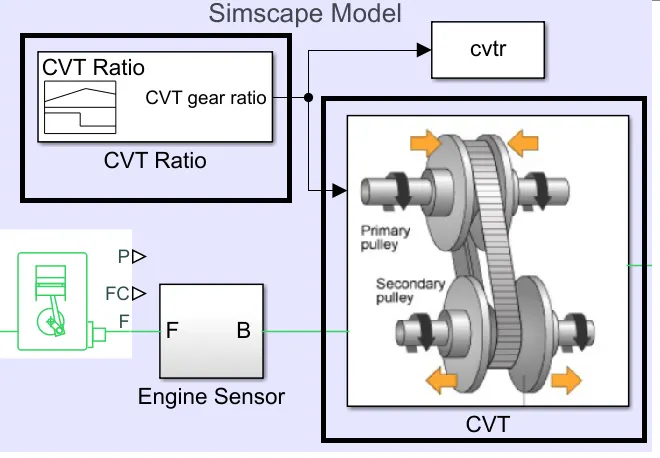
- Before connecting to the axel a simple gear block is used.
Vehicle Body Block:
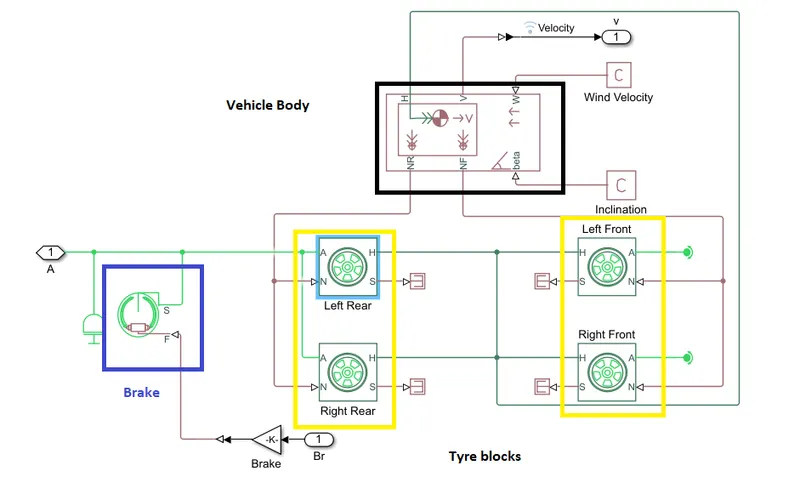
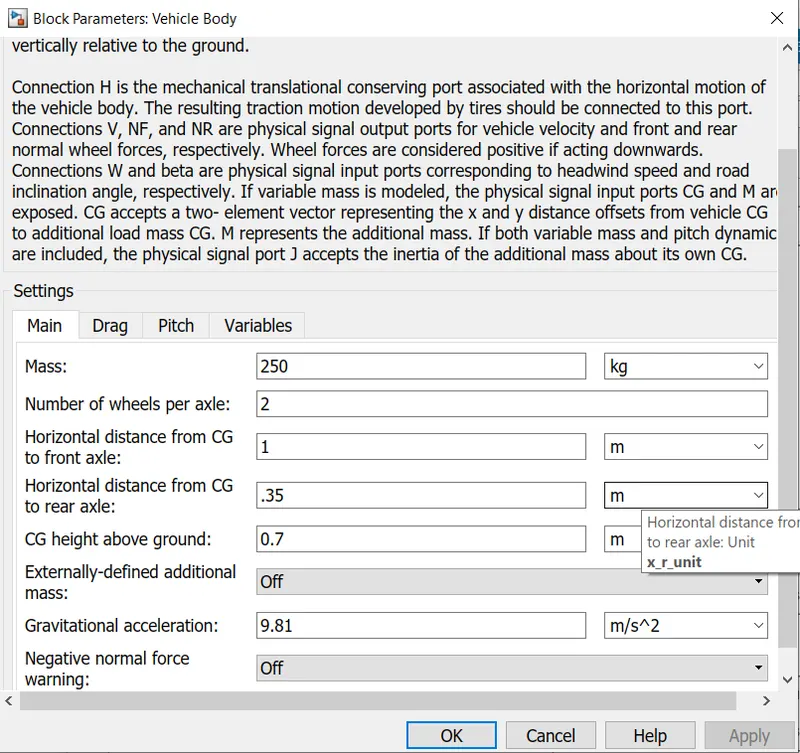
- Vehicle Body is a buildin simscape block to model the vehicle mass,drag,axel,wheel per axel and forces on the vehicle.
- The overall Model is
Simulation and Result:
Inputs:
Output:
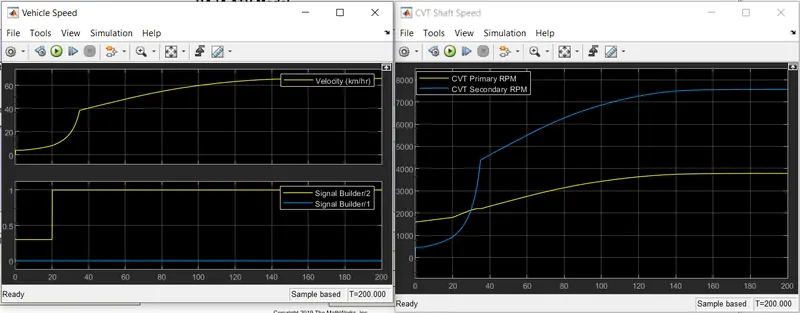
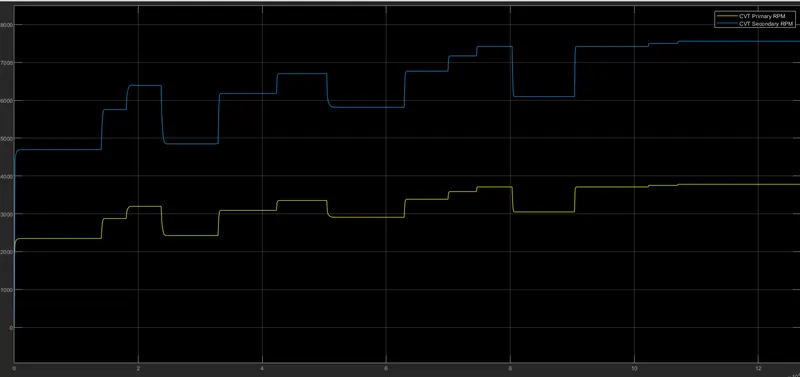
- It is clear that at lower CVT Gear Ratio the econdary pully rpm is greater and reaches its maximum.
Model that use rpm to get CVT gear ratio using lookup table:
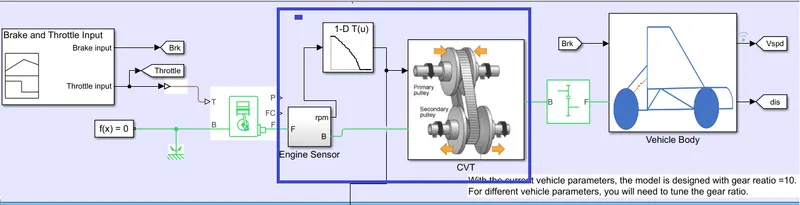
output:
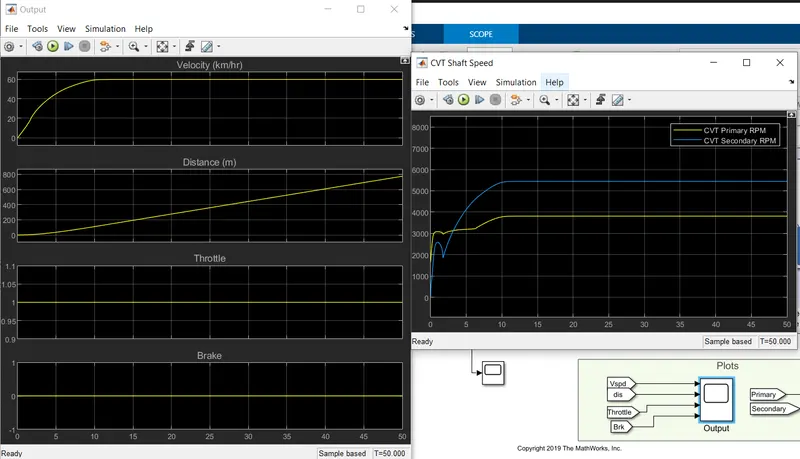
Model that uses Velocity of vehicle for CVT gear ratio:
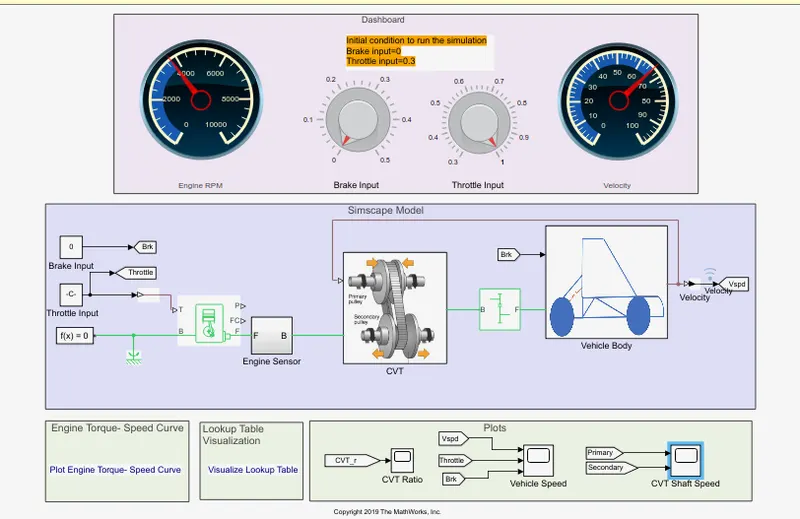
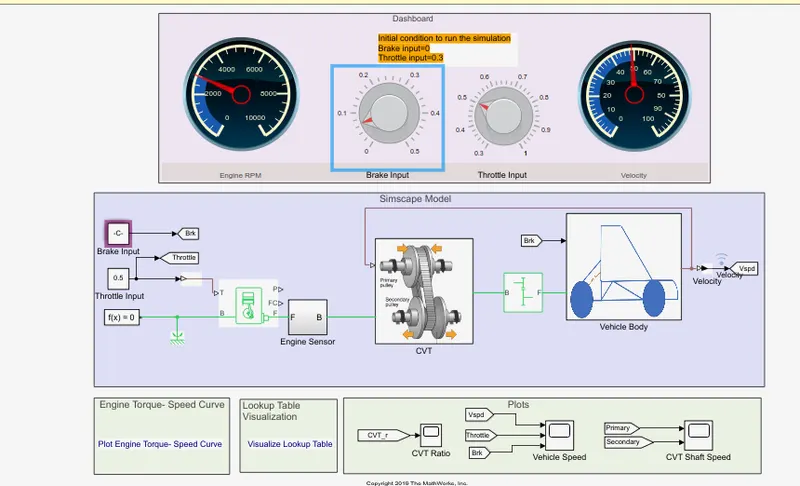
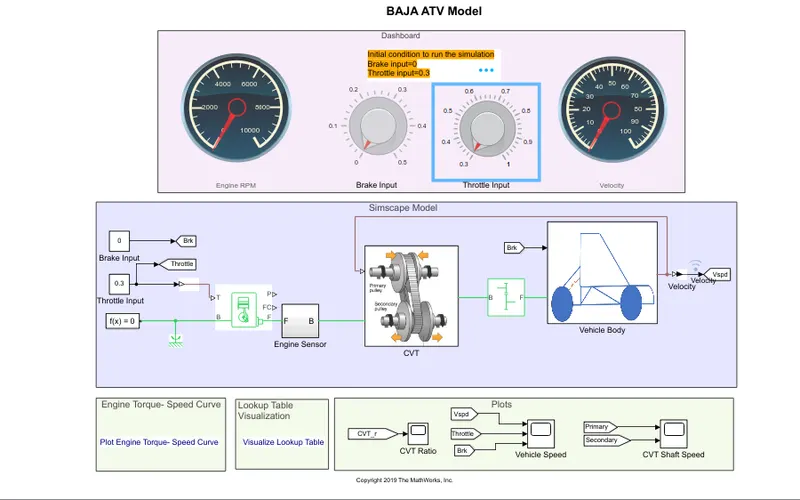
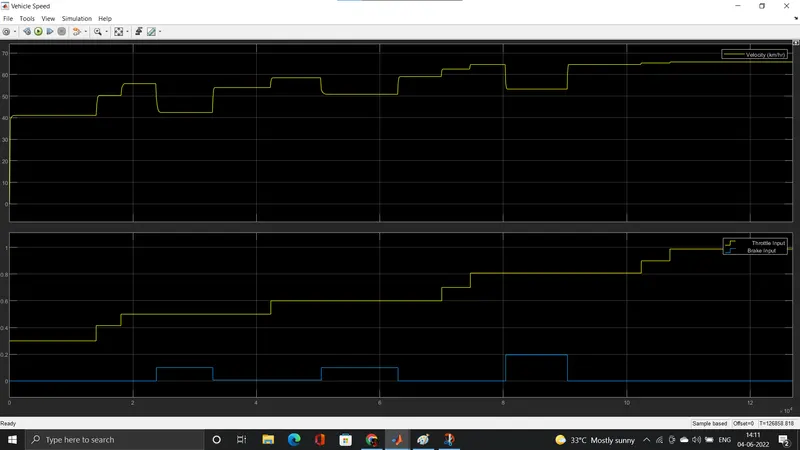
- This Dashboard model is used to visuvalize the change in rpm and speed of vehicle when the throttel and brae input changes.This model is developed with the help of dashboard blocks.
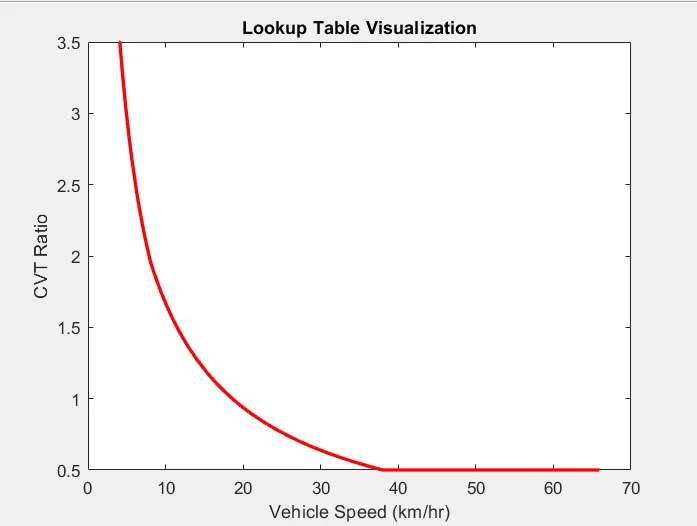
The CVT Gear ratio:
Plot for Primary vs Secondary pulley rpm:
Conclusion:
- We have 3 models each model is used to show the fuctional behaviour of the CVT system.
- The first model uses the the signal builder blocks for throttle,brae and CVT gear ratios.
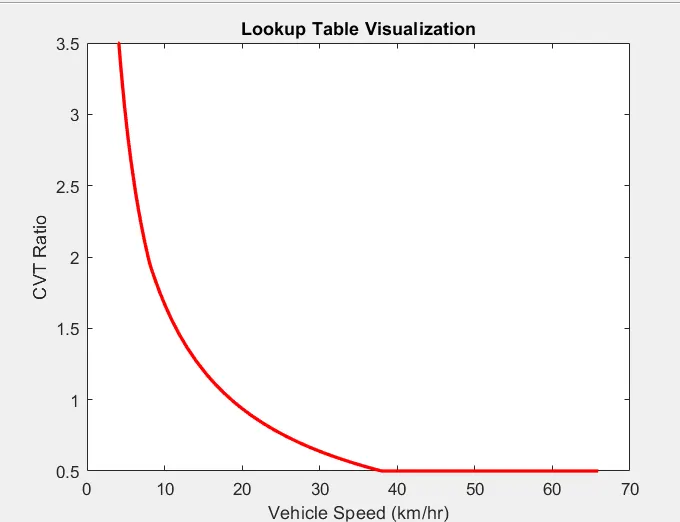
- The next following model uses the look up table for the CVT gear ratios against rpm and velocity of the vehicle Datas are collected by simulating the first model.And this datas are used for the next models as lookup Table.
- The Dashboard model is developed to visuvalize the cause and effect.