Week-4 Challenge WOT Condition Part-2
1.MAPPED MODEL:
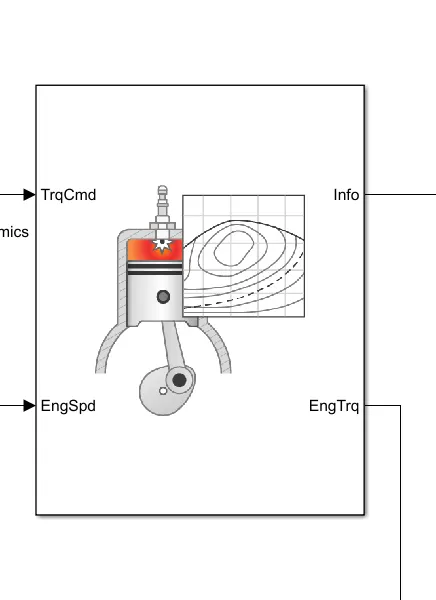
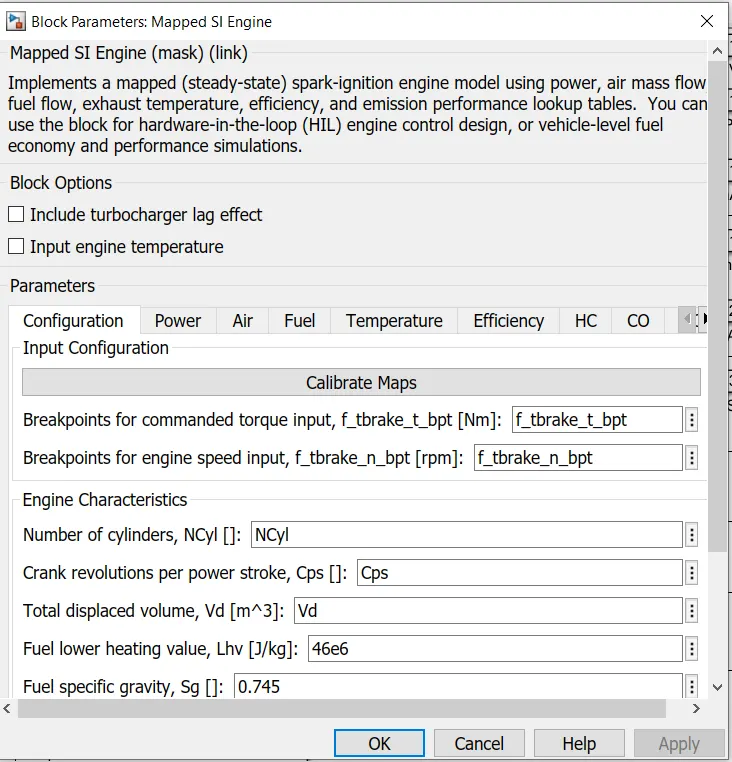
- Mapped engines represent macro engine behavior as a set of lookup tables (brake torque, fuel flow, air mass flow, exhaust temperature, efficiency, and emissions) as functions of commanded load and measured engine speed.
- Mapped engine models are suitable for analysis and design activities that do not require engine subsystem dynamic characteristics, for example, in engine and transmission powertrain matching analysis for fuel economy, emissions, and performance tradeoffs.
DYNAMIC MODEL:
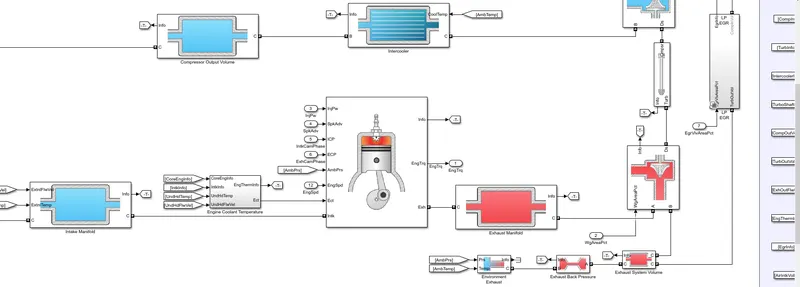
- Dynamic engines decompose engine behavior into individual component models that account for engine dynamics, most notably intake airflow and turbocharger dynamics.
- Dynamic engine models are suitable for designing control, estimator, and diagnostic algorithms that depend on dynamic subsystem states, for example, in closed-loop AFR control algorithm development.
TO CHANGE BETWEEN TWO MODELS:
- If you open the siciptReferenceModel it will shows the model in that if we open the passenger car->Engine we able to 5 subsystems like SIMAPPED,SIDYNAMIC,CIMAPPED,CI DYNAMIC, SI DEEPLEARNING.
- By default SI MAPPED engine is selected.
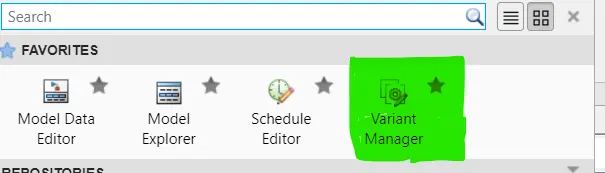
- Choose VARIENT MANAGER IN Toolbar under modelling.
- It will show the model hierarcy in which right click the subsystem and choose SET AS LABEL MODE ACTIVE CHOICE.
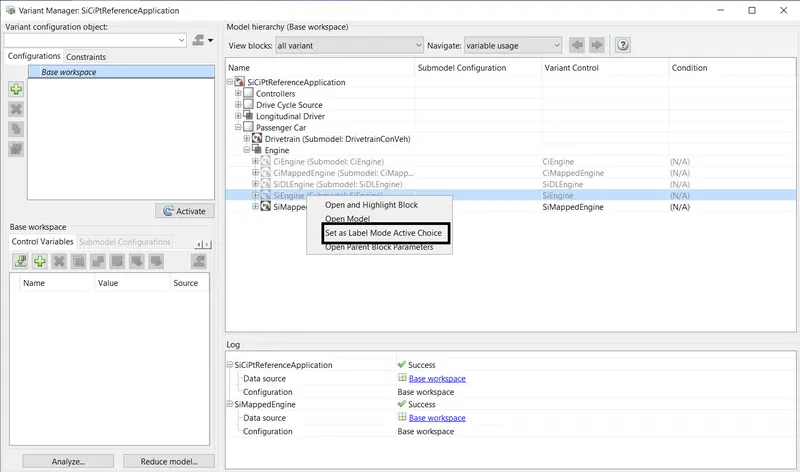
- The selected model will get activated in the selected subsystem.
-------------------------------------------------------------------------------------------------------------------------------------------
2.How does the model calculate miles per gallon? Which factors are considered to model fuel flow?
The fuel consumption is calculated in VISUALIZATION subsystem in performance calculation.
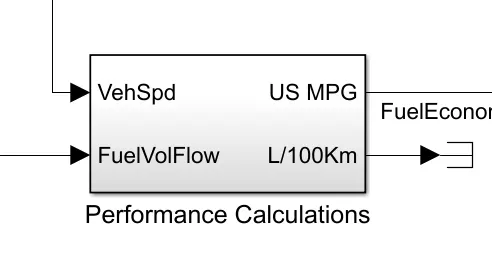
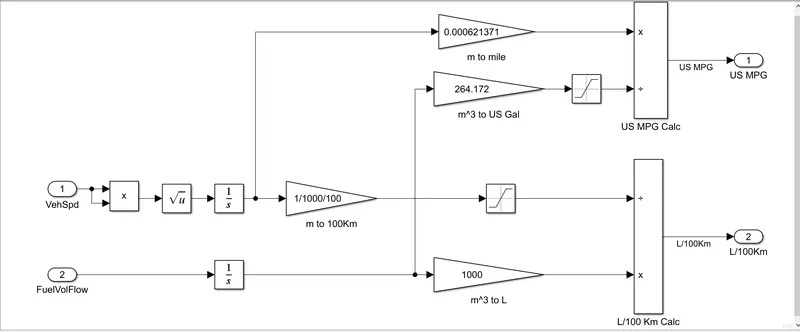
- The fuel consumption in Us is calculated in miles per galon
- The vehicle spped is conveted in to DISTANCE by integrating the speed and we will get the distance covered in meters over time.
- to convert meters to miles multiply it by 0.00062137.
- Likewise if we integrate the fuelvolumeflow over time we will get the fuel used intravel over time,This will return in volume ie cu.m.
- To convert m^3 to galon multiply by 264.172.
- Finally when we divide the fuel consumed over the travel to distance travelled over a time we will get how much distance we cover for 1 galon of fuel (miles per galon). in otherwords milage.
------------------------------------------------------------------------------------------------------------------------------------------
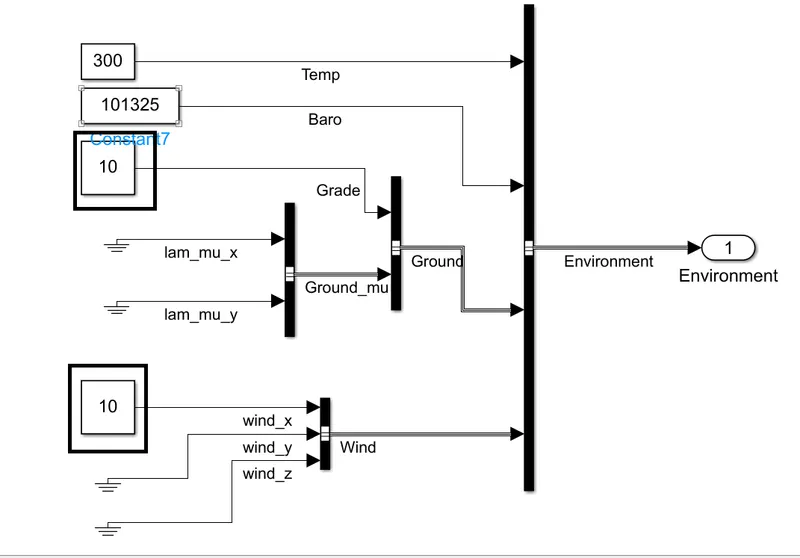
3.Run the HEV ReferenceApplication with WOT drive cycle. Change the grade and wind velocity in the environment block. Comment on the results.
As i run HEV multimode Reference application without grade and velocity.the results are
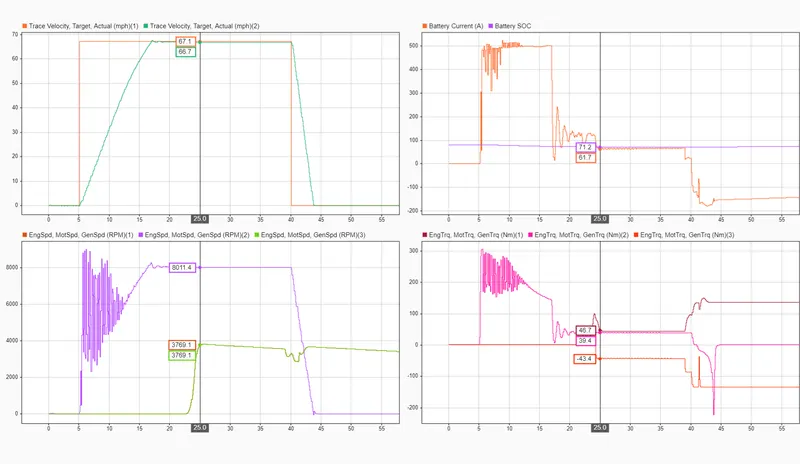
Then grade and wind vector in x axis is added
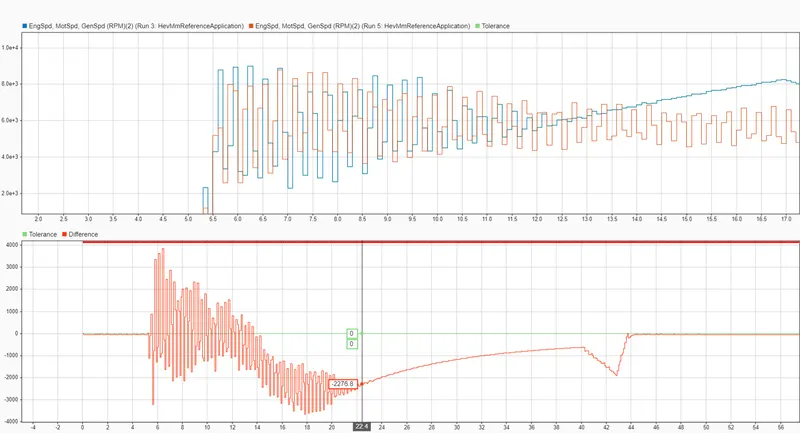
COMPARISION:
MOTOR RPM
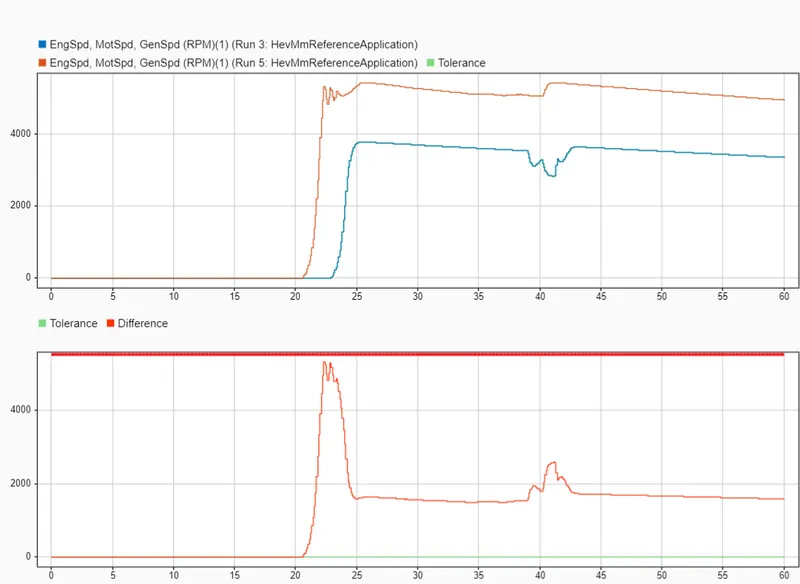
ENGINE RPM
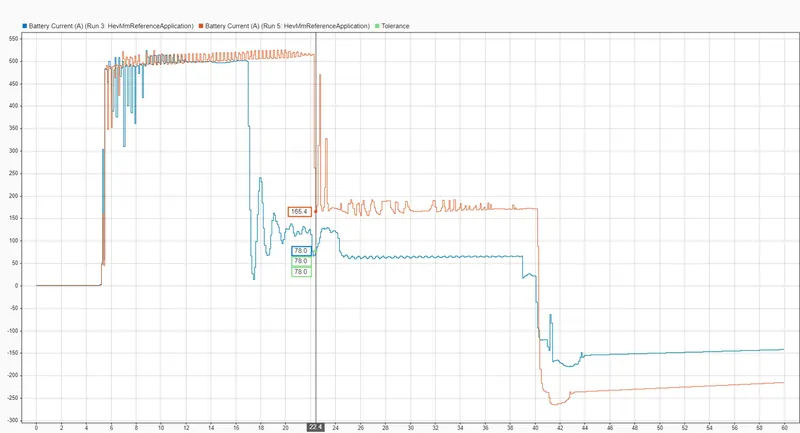
BATTERY CURRENT
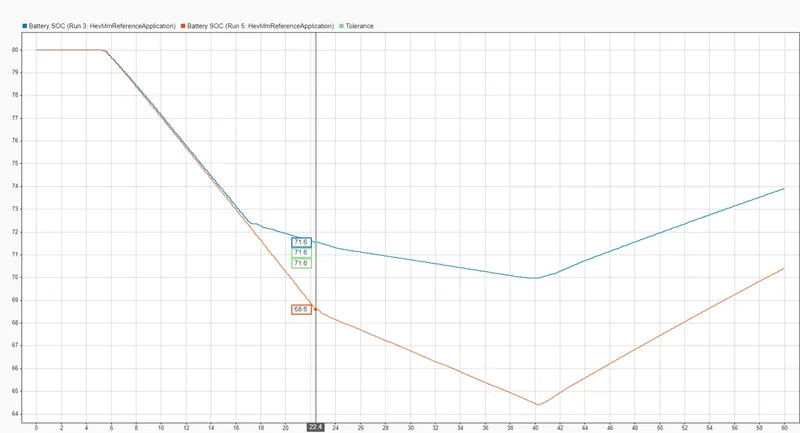
BATTERY SOC
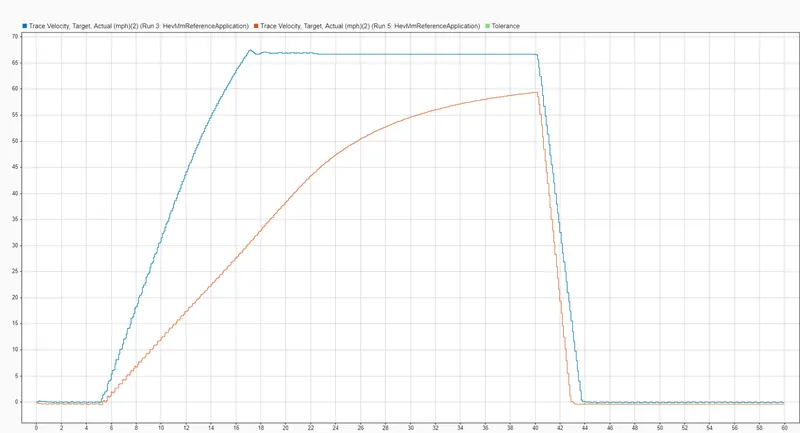
VEHICLE SPEED
RESULTS:
We can able to see that when grade and Air velocity vectors are added that results in
- vehicle speed reduces
- Battery soc reduces
- Battery current increases.
- Motor rpm,engine RPM reduced.
-------------------------------------------------------------------------------------------------------------------------------------------
4.Keeping all other parameters same, compare the simulated results of hybrid and pure electric powertrains.
HEV:
EV:
CONSIDERATIONS:
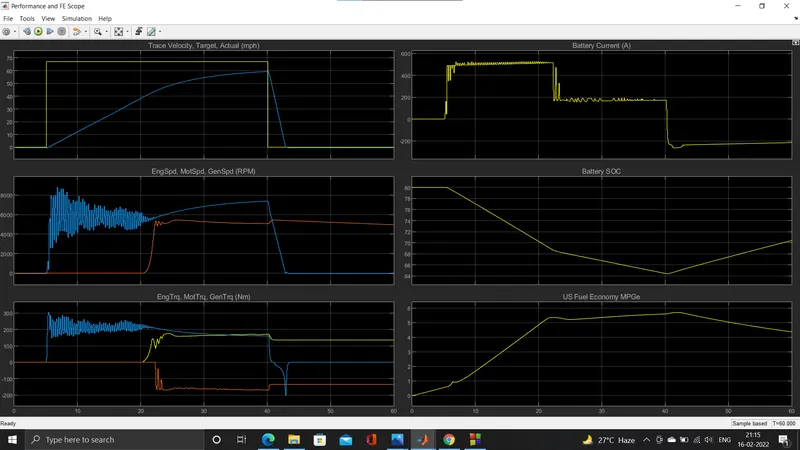
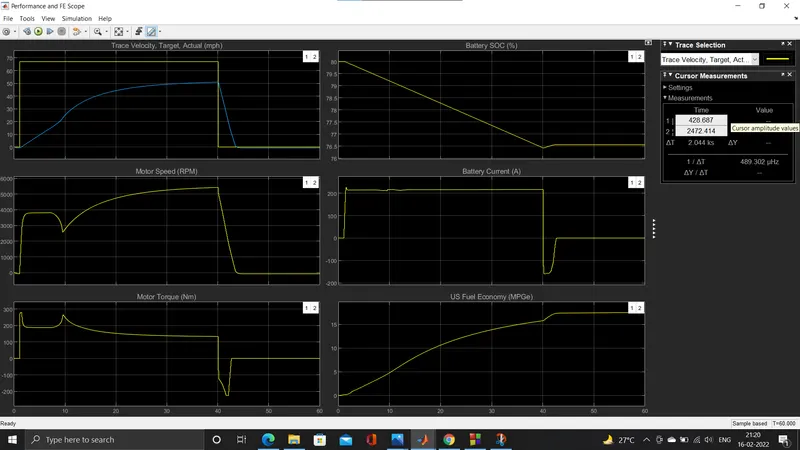
- Both HEV and EV are simulated for WOT cycle for 60sec with top speed 108kmph and decelerate after 40 sec.
RESULTS:
- In first graph is Target velocity and Actual velocity,For both HEV and EV the plot is quiet similar,but the EV doesn't reach the top speed.
- The Motor RPM in HEV is around 8000 rpm and for EV its around 6000 rpm(max) for same torque.This clearly shows for high rpm the motor required high current and consume more power from battery and this will required more battery capacity else it required better battery management system and it will increase overall cost.
- The next is battery output current foe EV is around 210A(max) and for HEV is 500A(max).
- The battery SOC at end of WOT for EV is 76% but for HEV 70% remaining.
- The avg fuel economy for this WOT cycle for HEV is around 7mpg and for EV 17mpg.