Project
Aim:
Study and Analyse the Baja All-Terrain Vehicle(ATV) Model using Simulink.
Objective:
To prepare a technical report of ATV model with Dashboard,signalBuilder, with workspace model, and with a Lookup table.
- Analyze the ATV model without Dashboard
- Analyze the ATV model with Dashboard
- Analyze the ATV model with CVT Ratio in the workspace
- Analyze the ATV model with a lookup table.
- Analyze the ATV model with lookup table and Dashboard.
Description:
All-Terrain Vehicle:
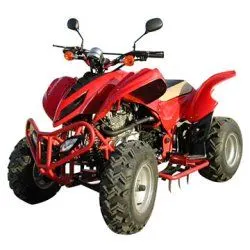
An all-terrain vehicle (ATV) is defined as a motorized off-highway vehicle designed to travel on four low-pressure or non-pneumatic tires, having a seat designed to be straddled by the operator and handlebars for steering control. ATVs are subdivided into two types as designated by the manufacturer. Type I ATVs are intended by the manufacturer for use by a single operator and no passenger.
Blocks Used:
- Brake Input
- Throttle
- Generic Engine
- Engine Sensor
- Simple Gear
- CVT
- Vehicle Body
- Variable Ratio Transmission Block
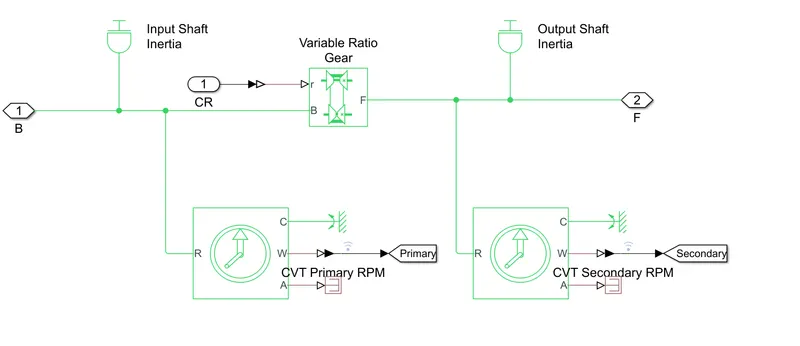
Continuous Variable Transmission(CVT):
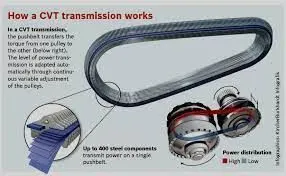
In CVT, Two cone-shaped pulleys connected by a steel or composite belt, whose diameter ate continuously varies, work together to provide an infinite gear ratio. Optimizing engine speed in a variety of road conditions, according to the speed and torque requirement of the terrain. Differ from automatic transmission in the sense that arent gears the vehicle needs to step up\down to for different speed\torque requirements. similar to automatic transmission in the sense that the gear is shifted automatically.
Generic Engine Block:
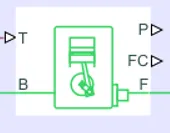
The Generic Enginee block represents a general integral combustion engine. Engine types include spark-ignition and diesel. speed power and speed-torque parameterizations are provided. A throttle physical signal input specifies the normalized engine torque. Optional dynamics parameters include crankshaft inertia and response time lag. A physical signal port output engine fuel consumption model. Optional speed and redline controller prevent the engine to stall and enable cruise control
Block Port:
B Rotational conserving port representing the engine block
F Rotational conserving port representing the Engine crankshaft
T Physical signal input port specifying the normalized engine throttle level
P Physical signal output port reporting the instantaneous engine power, in W
FC Physical signal output reporting the fuel consumption rate in kg/s
Variable Transmission Ratio:
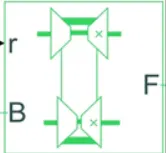
It represents a variable ratio gearbox such as implemented by the mechanical belt CVT, electric or hydraulic transmission. The physical signal input r frdines the ratio of input to output angular shaft velocities. connection B (Base) and F (follower) are the mechanical rotational conserving ports. Specify the relationship between the base and the follower rotation direction with the output shaft rotate parameter.
Simple Gear:
The simple Gear block represents a gearbox that constrains the connected drivelineaxes of the base gear, B, and the follower gear F to corotate with a fixed ratio that you specify. You the whether the follower axis rotates in the same or opposite directions the base axis.
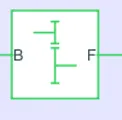
B indicates Base
F indicates Follower:
Vehicle Body:
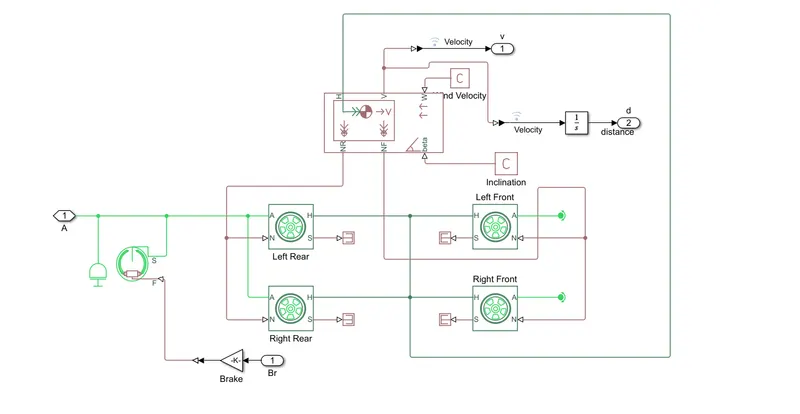
The vehicle Body block represents a two-axle vehicle body in longitudinal motion. The vehicle can have the same or a different number of wheels on each axle. For example, two wheels on the front axle and one wheel on the rear axle. The vehicle wheels are assumed identical in size. The vehicle can also have a center of gravity that is at or below the plane of travel.
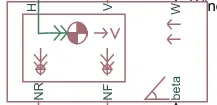
Block Port:
Input
W-Headwind speed m/s
beta-Road incline angle, rad
CG-center of gravity,m
M-Mass, Kg
J-External moments of inertia, Kg*m^2
Output:
v-Longitudinal velocity
NF-Front axle force, N
NR-Rear axle normal force, N
Conserving:
H-Horizontal motion
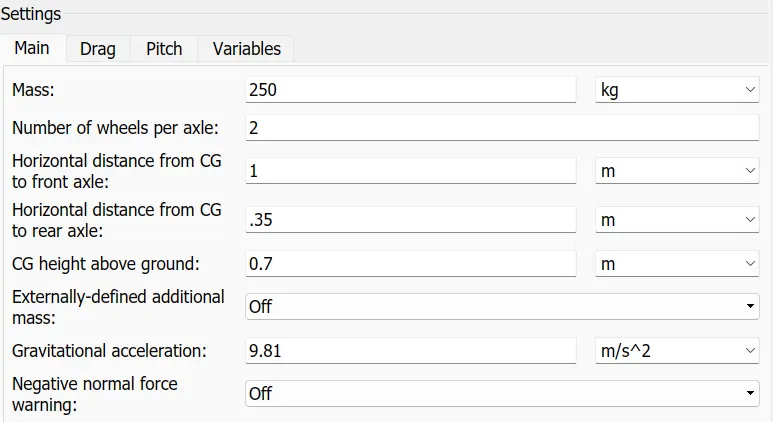
Parameter and values of Vehicle Boby
Tire:
The Tire block models a tire with longitudinal behavior given by the magic formula, an empirical equation based on fitting coefficient. The block can model tire dynamics under constant or variable pavement conditions.
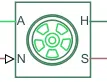
Block Ports
Input
N-Normal force
M-magic formula coefficient
Output
s-slip
conserving
A-Axle
H-Hub
Shoe Brake:
It represents a brake arranged as two pivoted rigid shoes symmetrically installed inside or outside a drum and operated by one actuator. The actuator force causes the shoe to exert friction torque on a shaft connected to the drum.

Engine Sensor:
This sensor is us to record the output values from the generic engine to the CVT. The subsystem of this block consists of the two PMC ports, one Ideal Rotational sensor, and the scope to display the changes in the value of the speed via increasing or decreasing the throttle.

Goto and From Blocks
Goto Blocks are used to send the signal to form blocks that have the specified tag and from blocs are used to receive signals from the Goto Blocks

Scope
It displays signals generated during simulation.
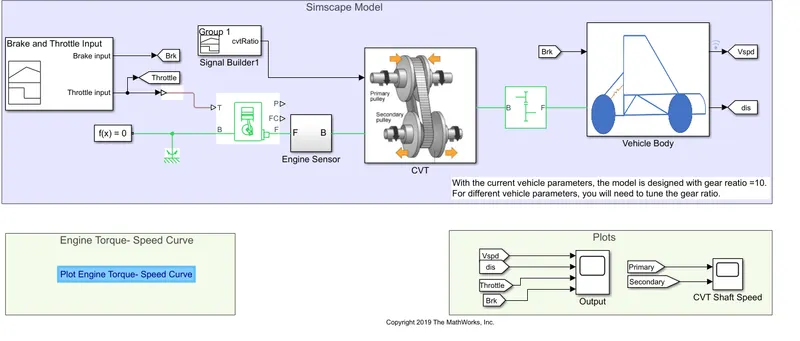
Model:1 CVT System without DashBoard
Model and Subsystem:
CVT Subsystem
Vehicle Body subsystem:
Working Procedure:
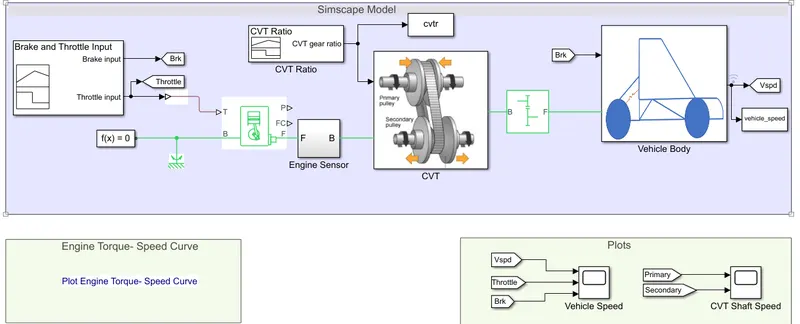
In this method, we use the signal builder for Break and Throttle input value to the system. Output from the throttle is connected to the generic engine block and the output of CVT gear ratio to the CVT block. An engine sensor is attached output from the generic engine block. And the output of the engine sensor is attached to the CVT block.
The CVT block takes the input from the CVT gear ratio and the engine parameter and provides an output on the wheel. To transfer the CVT power to the wheel, the simple gear block is attached in between them.
The power output from the simple gear block is attached to the input of the velocity body block where we can check the values of throttling and braking effect and display on the scope for the particular effect. Goto and From Block attached to the output of the vehicle body block and scope respectively to display the performance curve when we applied the brake and Throttle the vehicle.
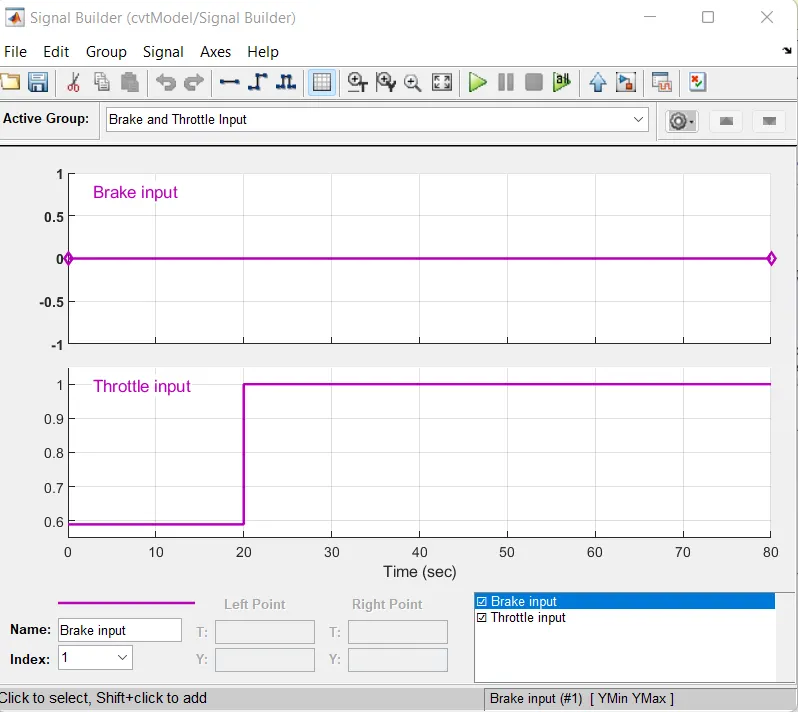
Above Graph is Throttle and Brake input signal, Builder
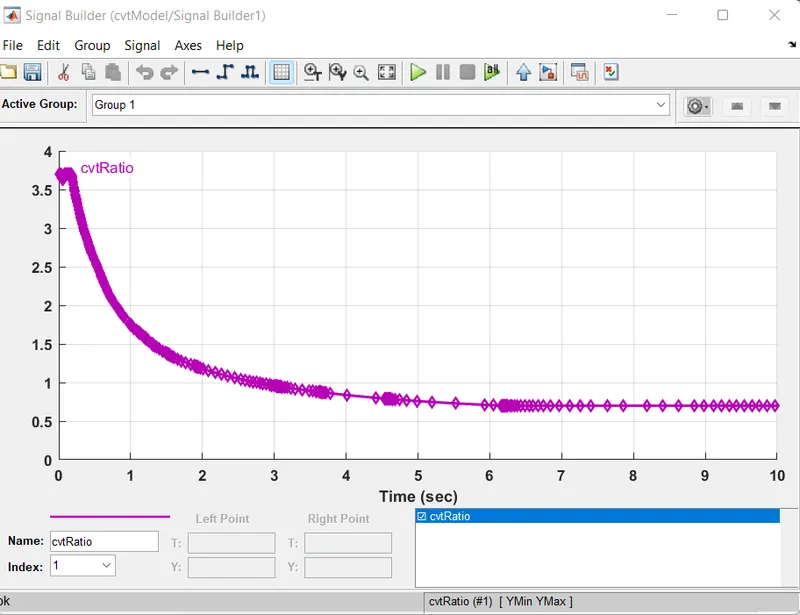
The above Graph provides the CVT gear ratio to the CVT
block.
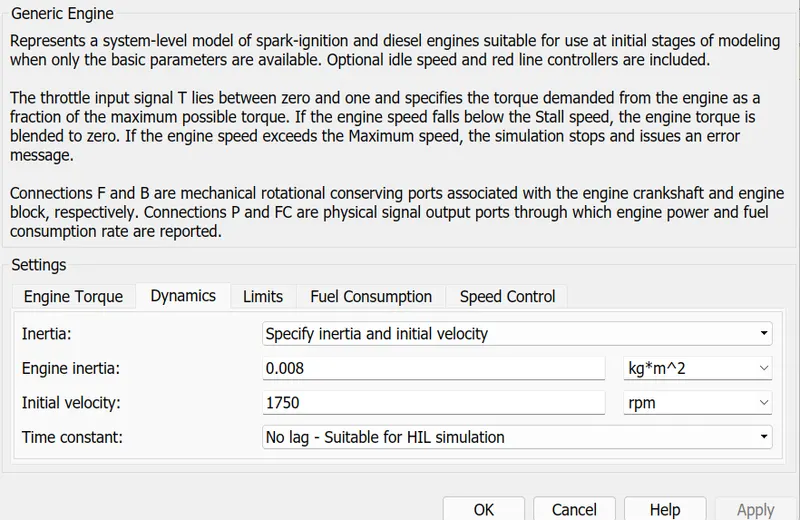
The above dialog box is used as the initial condition to the Generic Engine.
Output Plot
For the First Model
Speed vs Torque Curve
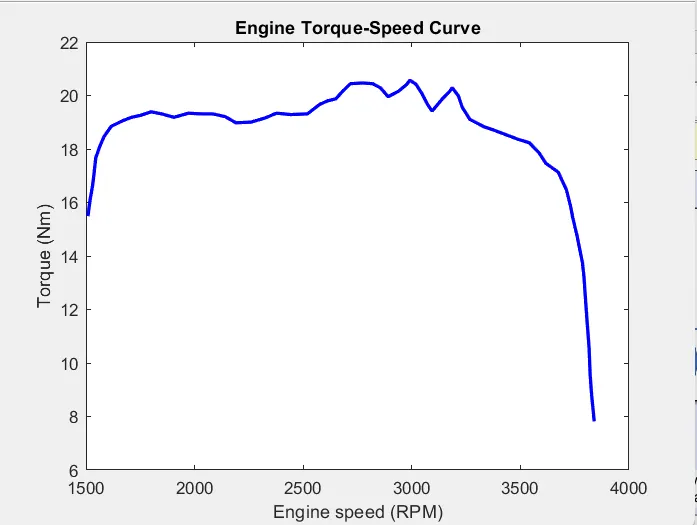
This Plot shows the input parameter which is given to the Generic Engine Block as Torque Vector and Speed Vector.
Variation in the Velocity, Distance, and Shaft:
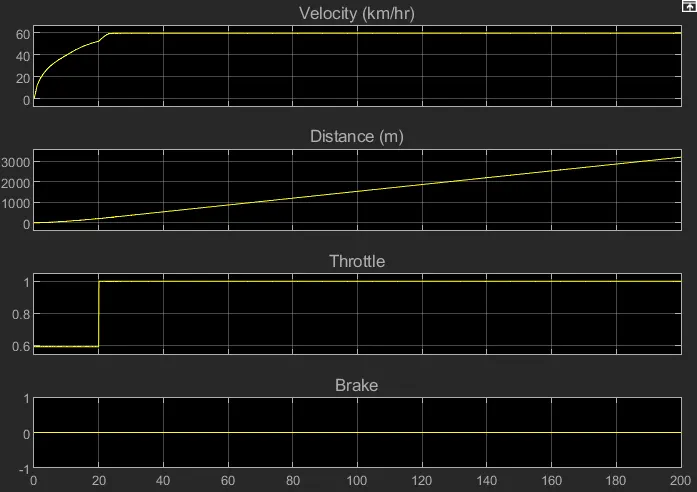
In the above figure, the brake is maintained as constant where the throttle is increased which shows an increase in velocity. When the throttle increases the flow of fuel increase when the value raises from 0.6 to 1 thus the power of the engine also increases. After some time velocity is constant because the gear ratio is maintained constantly.
CVT primary and Secondary RPM vs Time:
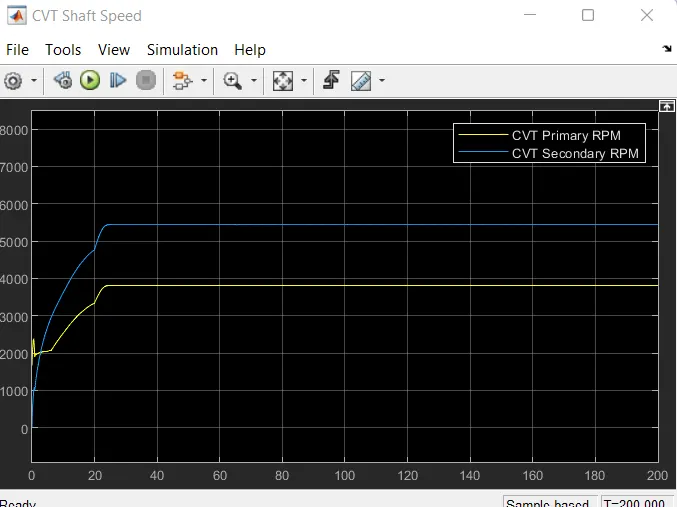
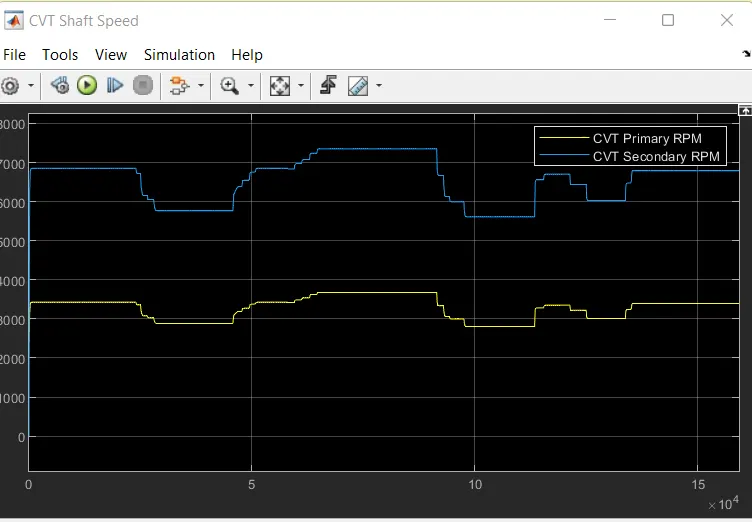
From graph provides the data of Primary and Secondary RPM. In the initial stage, Primary RPM is more and the Gear Ratio starts to Decrease RPM of the Primary Decrease and RPM of the Secondary start to increases. If the Grear ratio is less than 1 Primary RPM more than Secondary
The speed is Directly proportional to the Radius of the Shaft if the Shaft radius increases the speed of the shaft also increases
Model 2:BAJA ATV WITH DASHBOARD MODEL
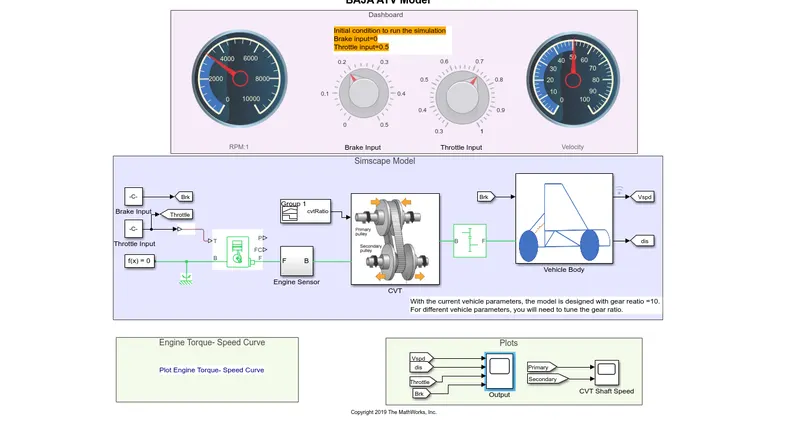
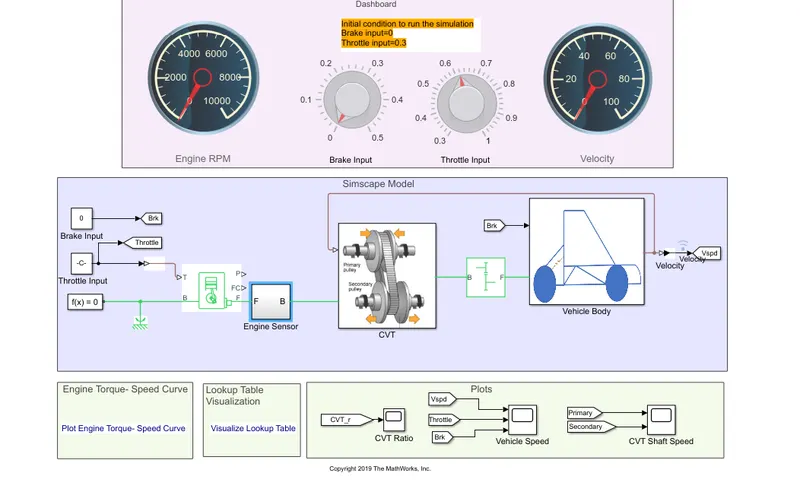
From the above block, we can see that the Throttle and Brake input is connected with the Dashboard instead of the signal Builder. The rest of the blocks and subsystems are common in the above model. The main concept of using the dashboard is to study the result by varying the input of brake and throttle, which shows the velocity and speed of the engine. The brake input varies from 0 to 0.5, the velocity and speed decrease accordingly.
Output Plot:
Variation of Velocity and Shaft speed
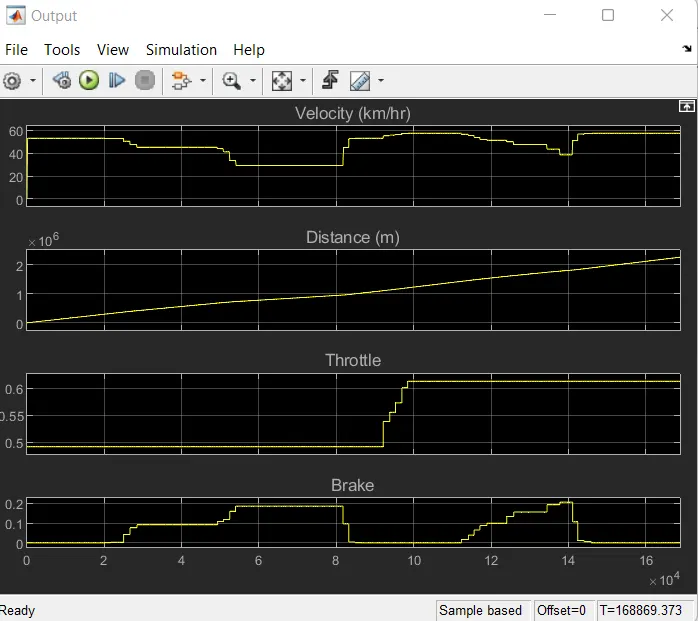
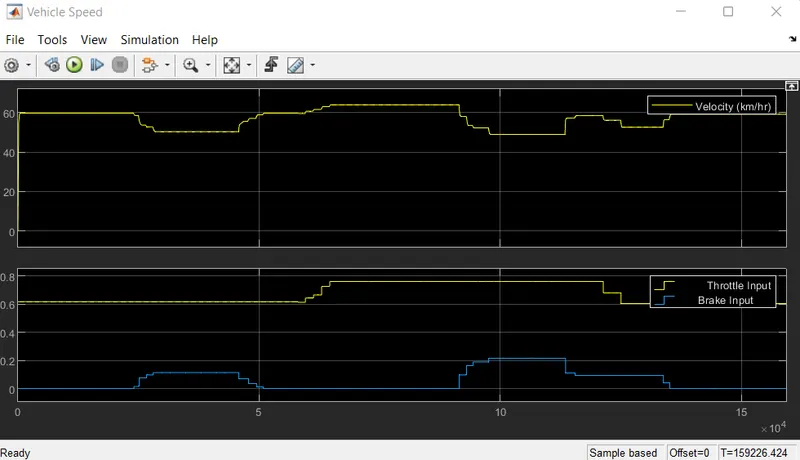
We can observe from the above graph that the throttle is has maintained constant at 0.5 for 8 sec but we can see the variation in velocity due to the Brake applied simultaneously. This graph shows that the velocity of the vehicle is can be varied by the throttle and brake.
Primary and secondary RPM
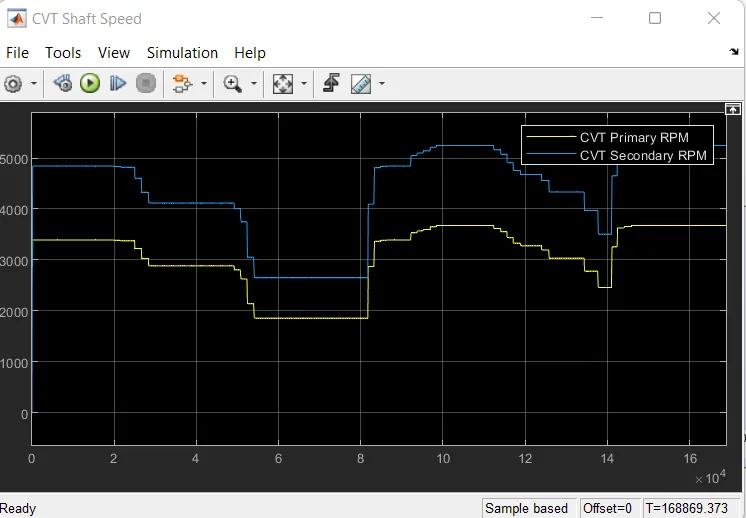
Model 3:CVT model Data
Models and Subsystems:
All the subsystems are the same as the first CVT model.
The process is also similar to the first model. But there is an extra block added called 'To Workspace' which is connected to the CVT gear ratio. This block is used to send the CVT ratio to the Matlab workspace and can be used for further analysis.
Output:
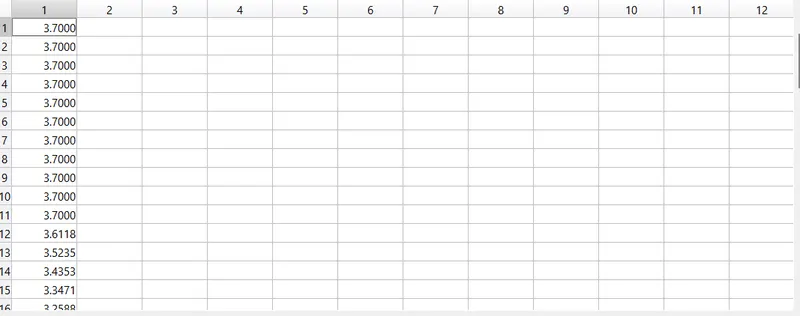
Model 4:CVT system Mapped
Model and Subsystem:
Model:
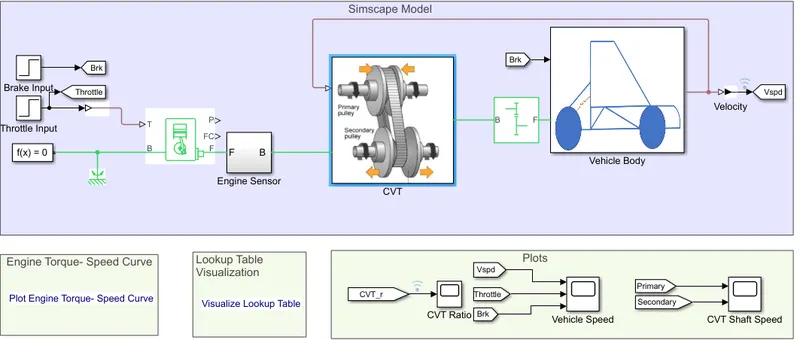
All the subsystems are the same as the Model 1:CVT
Instead of signal builder for Break and Throttle input, In this model step block is used. The throttle input initial value is 0.3 and the final value is 1 at 20 sec. Brake input is 0 throughout the simulation.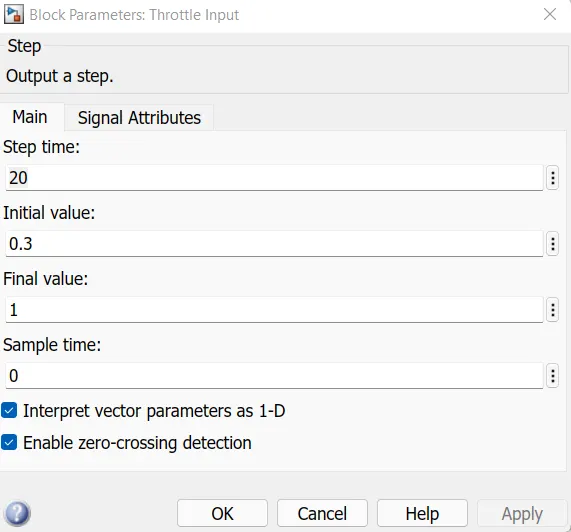
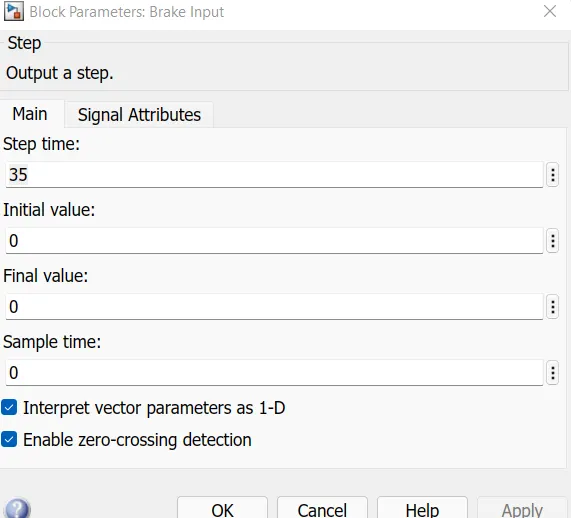
Instead of a signal builder for CVT gear ratio, a lookup table is used which uses the vehicle speed is used as a feedback signal for the lookup table. The data table is given using Matlab workspace. Vehicle speed is divided by 3.6 convert Kph to m/s 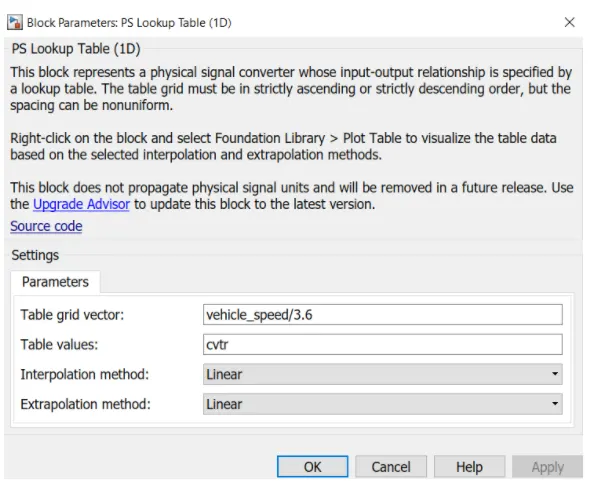
OutputPlot:
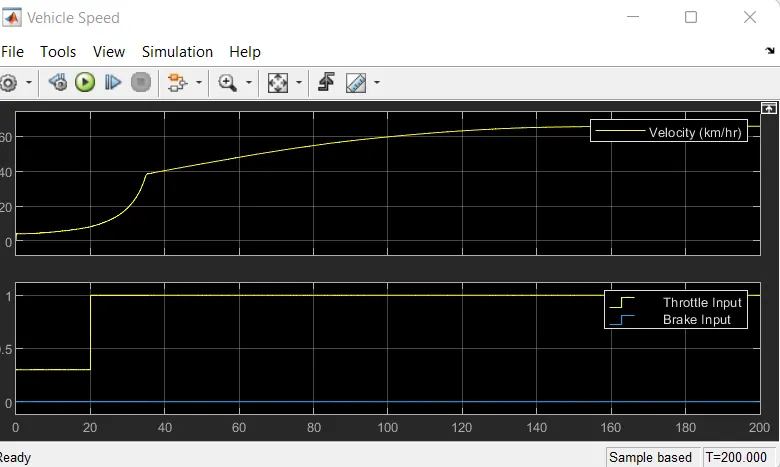
Brake is maintained constant and increase in the throttle which shows an increase in velocity. The gear ratio is assigned in the lookup table and given as input to Simulink.
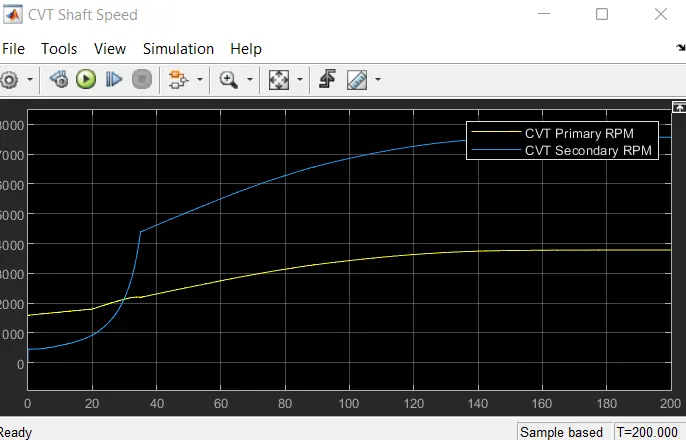
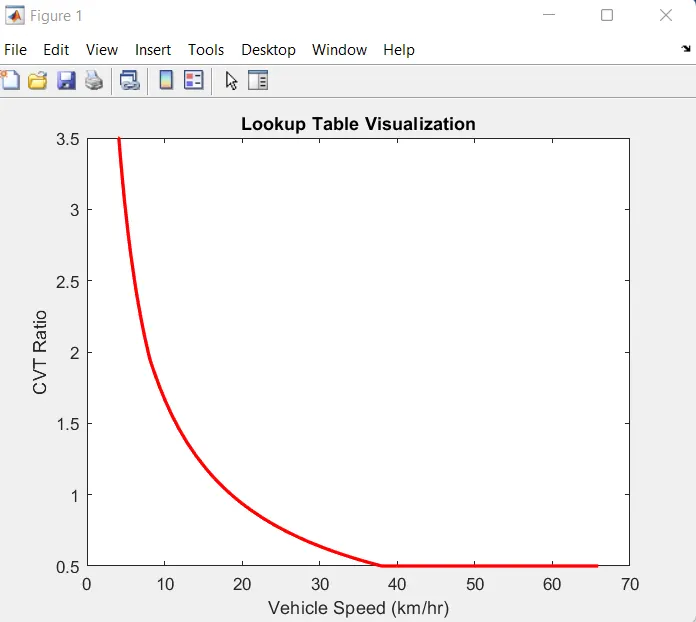
The Break input and throttle input is given by step time which depends on the run time and varies accordingly. By using the Lookup table for the gear ratio which takes as input to the CVT and works according to the input gear ratio and obtained the output. This method is very effective which can the unusual torque at a certain speed and very easy to achieve greater velocity and engine speed. Gear Ratio taken from 3.5 to 0.5 and maximum speed is 65.
Model 5:CVT System Mapped With Dashboard.
This model came as the Perivous one the only thing that changed is Throttle and Brake input are in the Dashboard for the Graphical representation to the user indicated as constant Block. The main usage of the Dashboard is varying the input during the run time so, we can see the variation of the velocity concerning the Braking. The gear ratio is given by the lookup table, Simulink gets the input value from the lookup table.
Output Plot:
The result from various Case study
- Velocity of the vehicle can be increased or Decreased by the Throttle Input
- For the Lower value of gear ratio speed more when compare to Higher gear ratio.
- As gear ratio increases torque increases which inturn speed decreases.
- Using Lookup table we can vary the input value and obtain the result