Project
Aim:
To prepare technical report explaining the model properties of Baja All-terrain Vehicle under different conditions.
Model:1
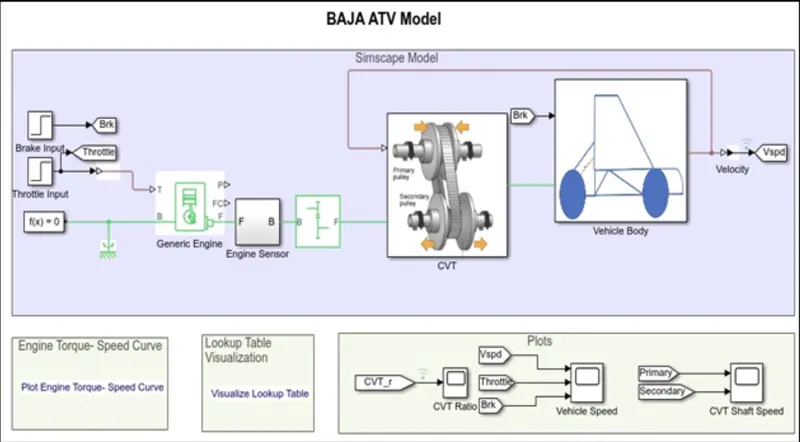
Simulink Model for BAJA ATV with CVT:
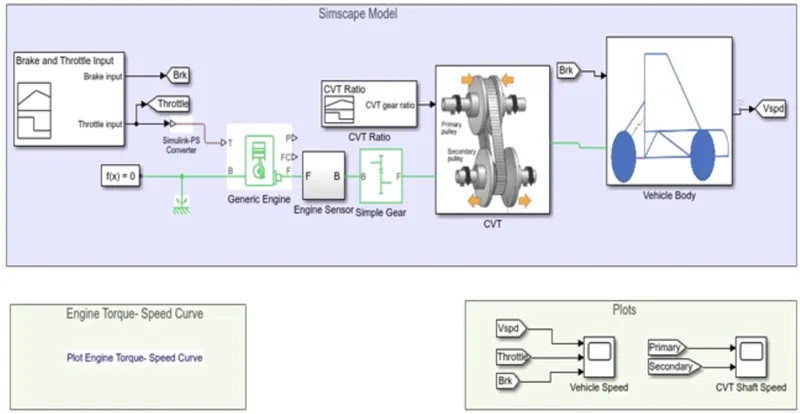
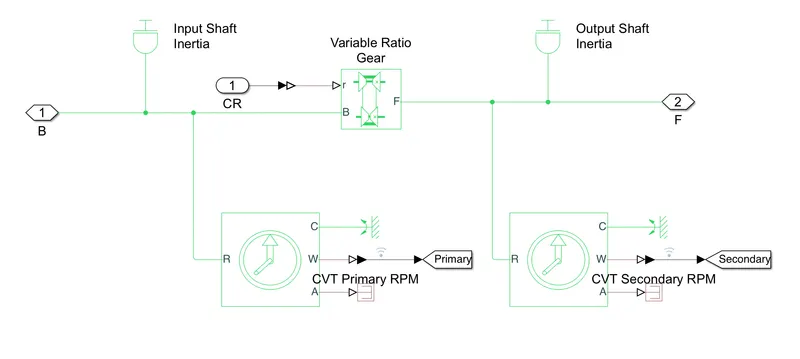
CVT Block:
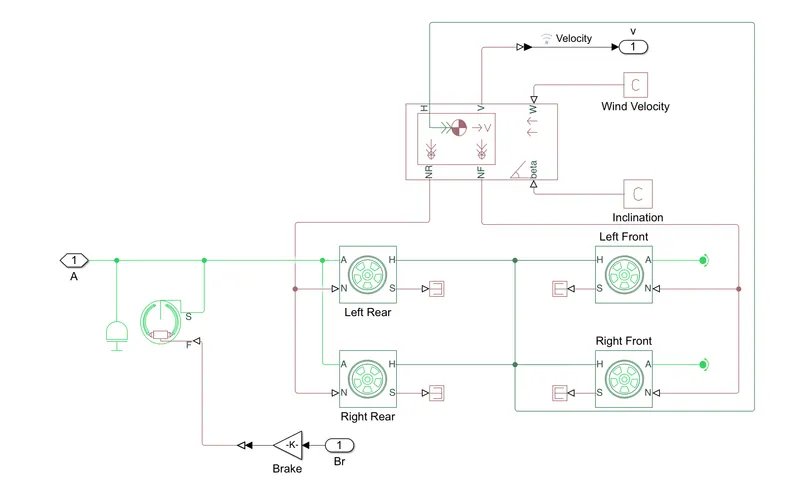
Vehicle Body Block:
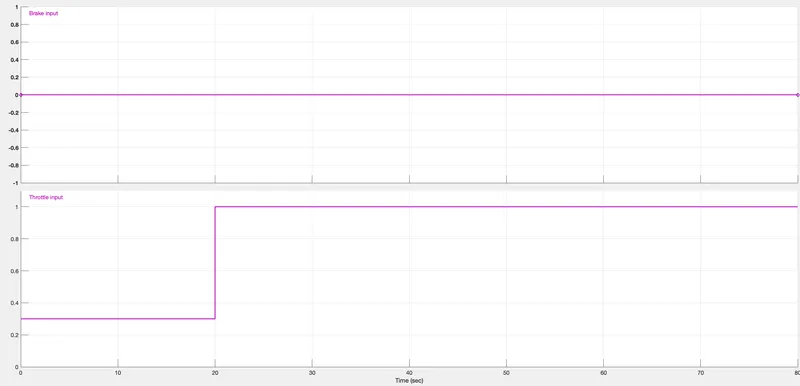
Input Signal:
A Signal Builder is used to create signals for brake and throttle
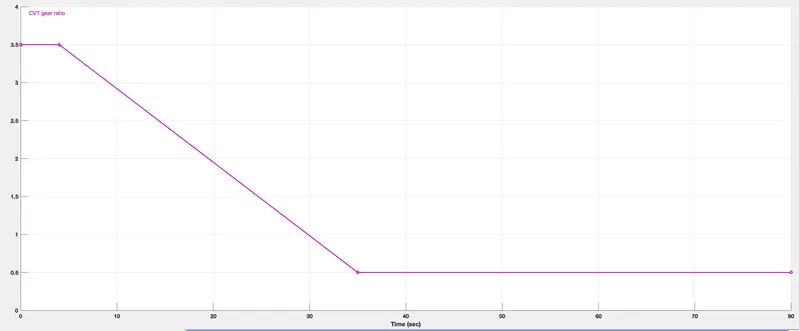
CVT Gear Ratio Input:
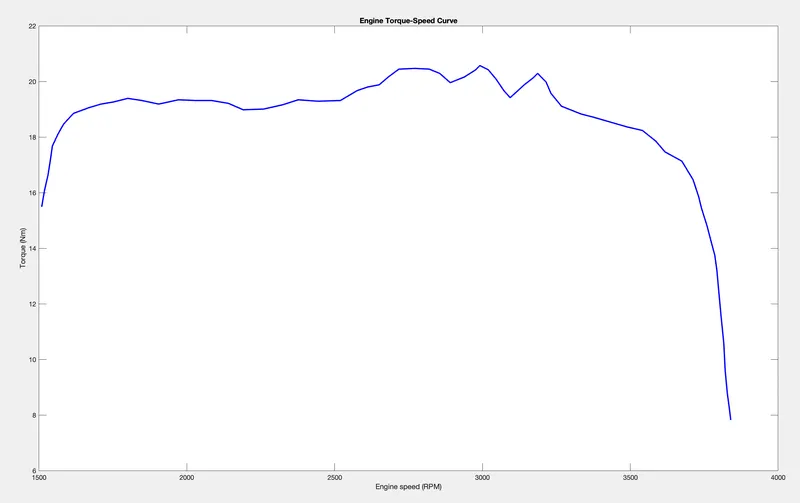
Torque Vs Engine Speed Curve:
OUTPUT:
Vehicle Speed:
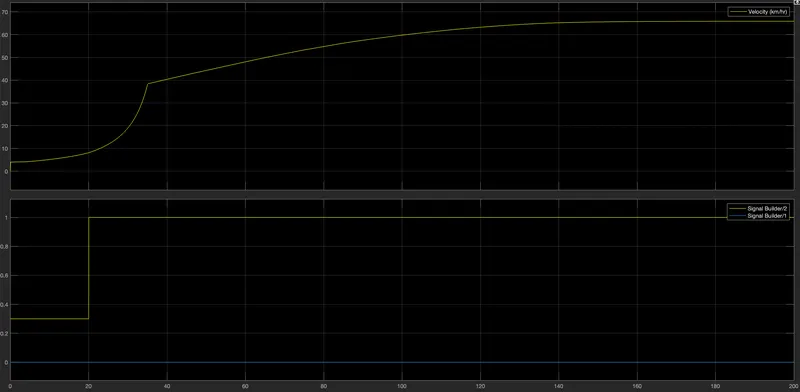
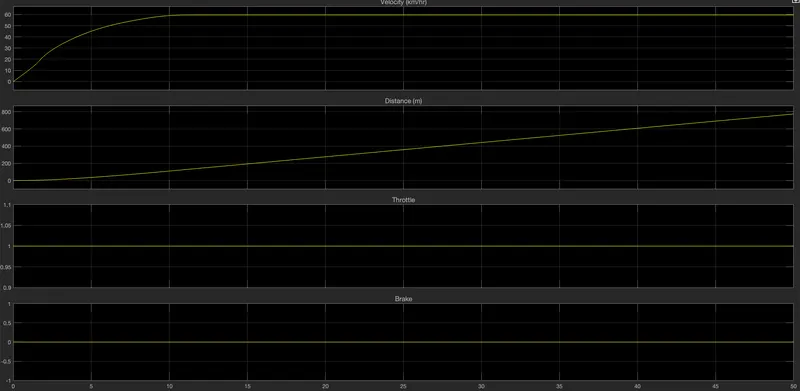
It is clear from the graph that the vehicle attains its maximum speed (65 km/hr) at full throttle after then remain constant. The brake input value is zero, hence no effect on velocity.
CVT shaft RPM:
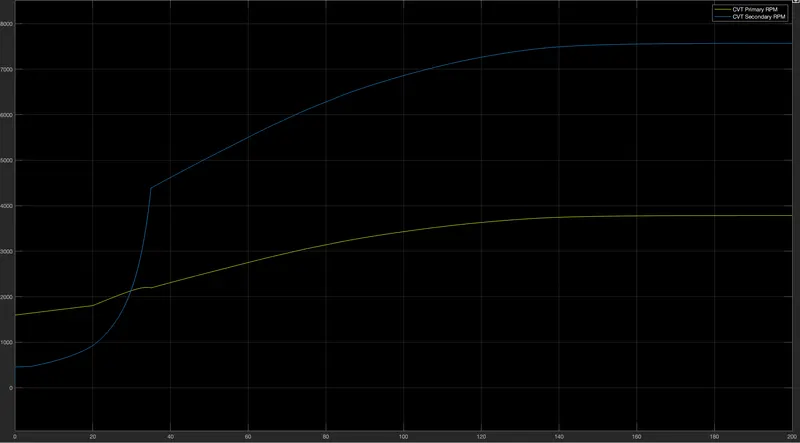
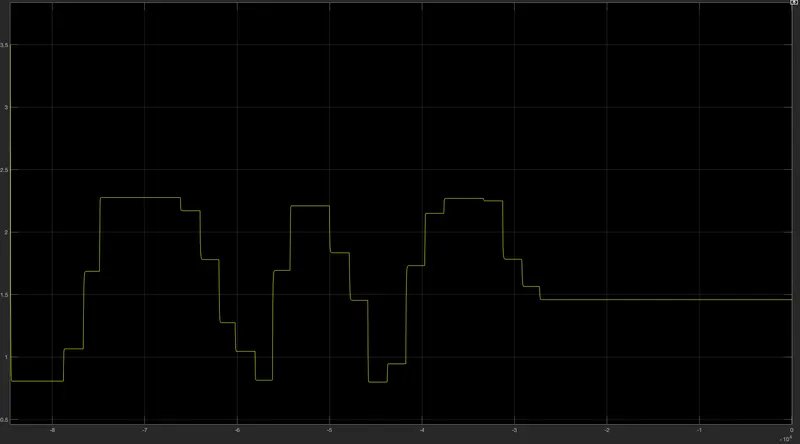
This shows the variation in angular velocities of input and output shafts of variable gear transmission system. These values differ w.r.t gear ration.
Model-2
Simulink Model for BAJA ATV with CVT using DASHBOARD:
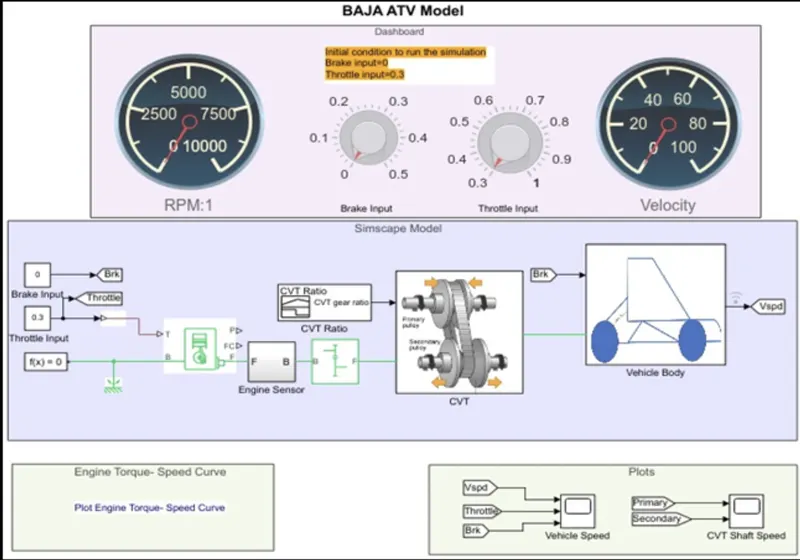
In this model we have a dashboard which contains knobs to control the inputs. In this case, the inputs (throttle and brake) are not provided using signal builder. A knob is provided to control both the parameters in real time for the user.
OUTPUT:
Vehicle Speed:
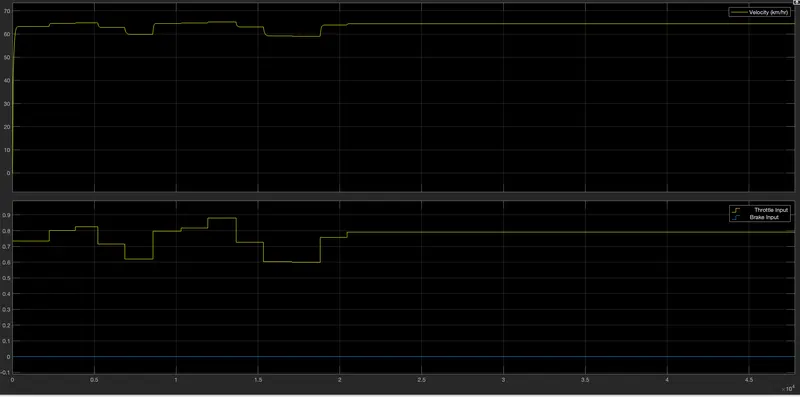
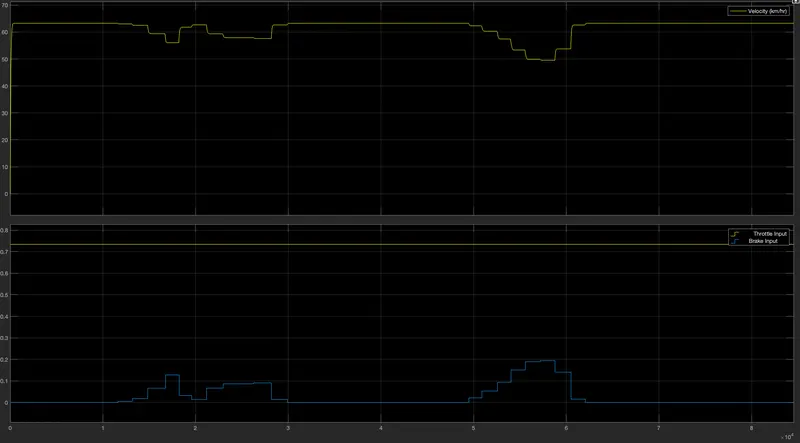
In this graph the vehicle velocity is varied w.r.t. change in throttle with brake input at 0. At constant throttle by increasing the brake value, the vehicle velocity decreases. This is how the vehicle velocity is related with the throttle and brake inputs.
CVT shaft RPM:
Model-3:
Simulink Model for BAJA ATV with CVT using LOOKUP table:
CVT Block:
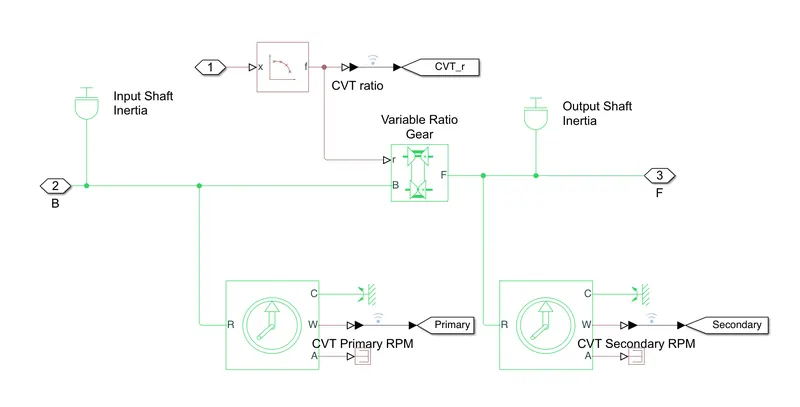
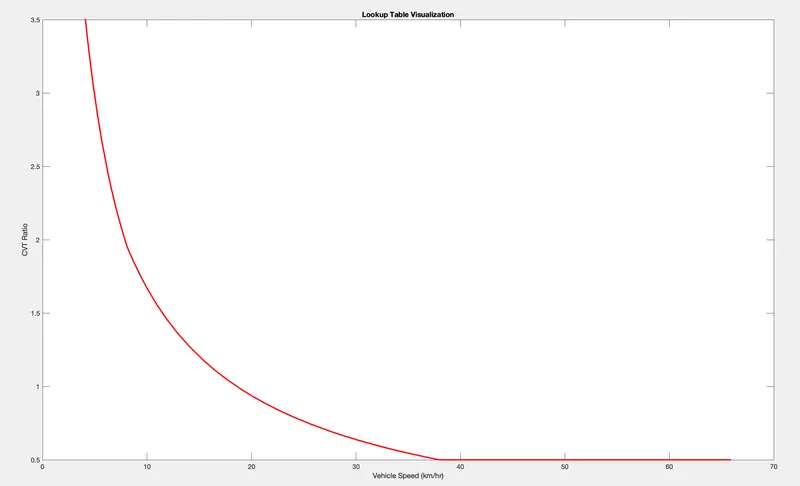
The only difference between this model and the first model is that, in this model the gear ratio input to CVT block is proved using a lookup table. The vehicle velocity and shaft rpm outputs are same as before.
Lookup table Visualisation:
OUTPUT:
Vehicle Speed:
CVT Shaft RPM:
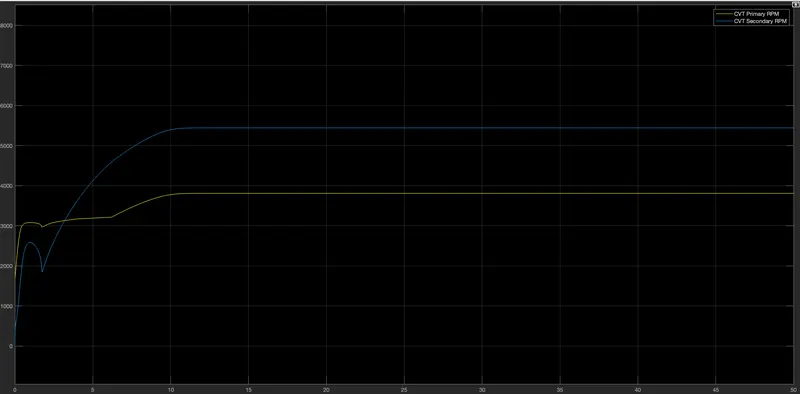
The output of this model and output of model-1 are same since the input parameters are same.
Model-4:
Simulink Model for BAJA ATV with CVT using LOOKUP TABLE and DASHBOARD:
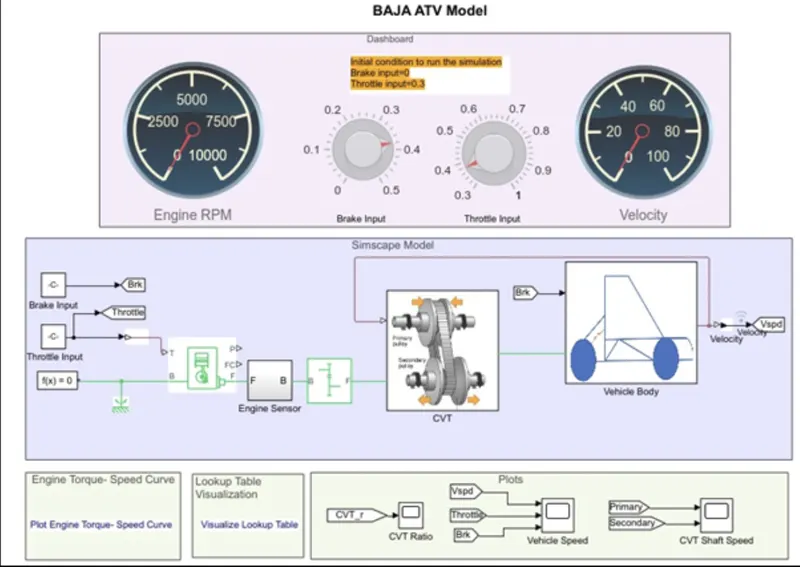
In this model dashboard is used to control the inputs (throttle and brake) with knobs.
OUTPUT:
Vehicle Speed:
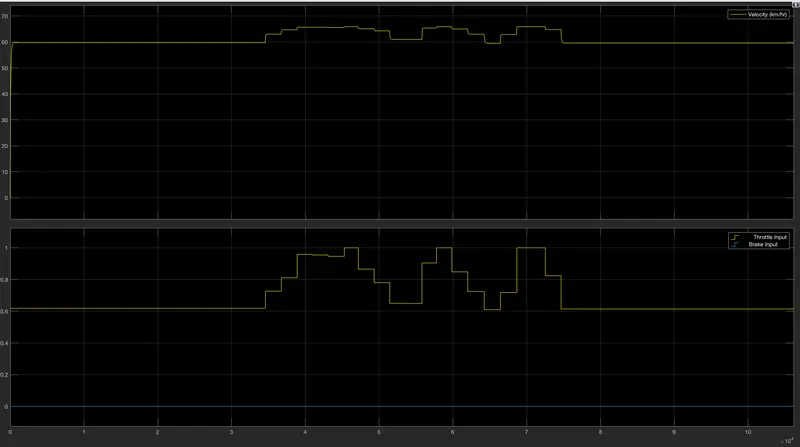
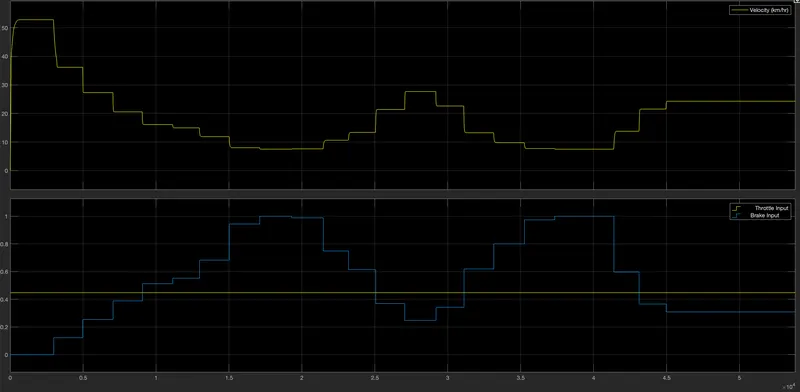
The output of this model is similar to that of Model-2. The variation in vehicle velocity w.r.t throttle and brake can be observed in this graph. With increase in throttle we can see that the vehicle velocity also increases and with increase in brake value the vehicle velocity is decreased.
CVT Shaft Speed:
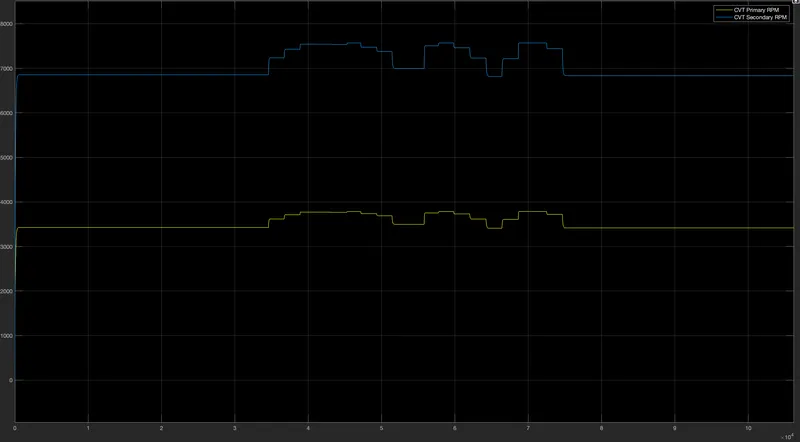
This shows the variation in rpm of primary and secondary shafts w.r.t. input parameters.
Result:
Thus the four models for BAJA ATV with CVT are analysed.