Project 2 Thermal modeling of battery pack
Optimal Temperature
The standard rating for batteries is at the temperature of 25 degrees C (about 77 F). At approximately -22 degrees F (-30 C), battery Ah capacity drops to 50%. At freezing, capacity is reduced by 20%. Capacity is increased at higher temperatures at 122 degrees F; battery capacity would be about 12% higher.
A car battery operates best when the air temperature is 80 degrees Fahrenheit (26.67 °C). It is said that the temperature under the hood will increase once the car’s driven several miles and stay at an elevated temperature for the trip’s duration. That is why when a heatwave arrives (90 degrees Fahrenheit (32.22 °C) or more), you will see more vehicles under threat.
High Temperature
At higher temperatures, the battery’s cyclic life would significantly reduce. If, for example, A battery operates at 30 °C (86 °F) rather than a more moderate lower temperature, the cycle life is reduced by 20 percent. At 40 °C (104 °F), the loss jumps to a whopping 40 percent, and if charged and discharged at 45 °C (113 °F), the cycle life is merely 50 % of what is often expected if used at 20 °C (68 °F).
An increment in the environmental temperatures will corrode the battery’s internal components leading to performance degradation and even weaken its power and capacity. The heat might not cause outright failure, but it will set the battery up for failure later. With the lead-acid battery, there’s the danger of the electrolyte freezing, which may crack the enclosure. Lead-acid freezes quicker with a coffee charge when the precise gravity is more like water than when fully charged.
High-temperature conditions accelerate thermal aging and may shorten the lifetime of batteries. Most of the time, high-temperature effects are attributed to batteries’ high internal temperature during operation rather than the environmental temperature. The high internal temperature is caused by heat generation inside the batteries, which happens at a high current state, including operations with a fast charging rate and fast discharging rate.
Low Temperature
Countries like Russia, Canada, and Greenland Island are generally high-altitude places with shallow temperatures throughout the year. Batteries will show slow chemical-reaction activity and charge-transfer velocity at these low operating temperatures, which leads to the decrease of ionic conductivity in the electrolytes and electrode-ion diffusivity. Such a decrease will result in the reduction of energy and power capability and sometimes even performance failure. At –20 °C (–4 °F), most batteries are at about 50 percent performance level. Although the NiCd battery can go all the way down to –40 °C (–40 °F), the permissible discharge is merely 0.2C (5-hour rate). Specialty Li-ion can operate to a temperature of –40 °C but only at a reduced discharge rate; charging at this temperature is out of the question.
Specifically, a battery operating at 100% capacity under optimum conditions will lose about half its strength when the temperature reaches 0 degrees Fahrenheit (-17.78 °C). For older and weaker batteries, capacity is already reduced, which means a cold snap can do them. Increased pressure on battery life also occurs when temperatures retreat and forth between optimum and extreme conditions.
Behaviour of battery with temperature variance
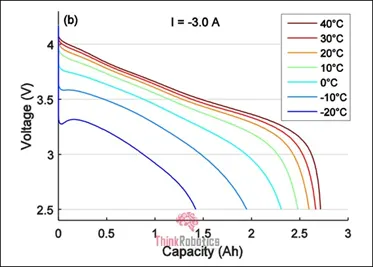
Figure 2 illustrates the discharge voltage of a 18650 Li-ion under various temperatures. A 3A discharge of a 2.8Ah cell represents a C-rate of 1.07C. The reduced capacity at a reduced temperature only applies while the cell is therein condition and can recover its optimal temperature. Both low temperature and a high temperature out of the scope will affect the performance and cause irreversible change to the Batteries. We can conclude that the cold temperature is not suitable for the battery; a warmer temperature is not right for the battery life.
Remedies
To control the operating temperature of batteries and ensure performance and safety, various battery thermal management systems (BTMSs) are designed for thermal management. However, it is difficult to monitor the temperature distribution inside the batteries, which are tightly sealed during operation.
The current cooling strategies are mainly based on air cooling, liquid cooling, and phase change material (PCM) cooling for the batteries working under high-temperature conditions. Liquid cooling seems to be more effective and attracts researchers mainly due to its higher heat transfer coefficient.
Depth of Discharge
A battery’s depth of discharge (DoD) is the percentage of the battery used up or discharged concerning the battery’s total capacity. This DoD has a direct relation with the battery’s lifespan and even the number of discharging/ charging cycles it can undergo or, in a single word, the ‘cycle life.’ The more frequently a battery is charged and discharged, the shorter is its lifecycle. It is generally not recommended to discharge a battery entirely, as that intensely shortens the battery’s usable life.
Manufacturers, at times, mention a maximum recommended DoD for optimum performance of the battery. That is, if a battery of say 12KW-h has DoD as say 68 %, then about 8.160 KW-h is the recommended discharge that the battery can undergo before its recharge. Any discharge below this value will eventually lead to a decrease in the cycle life of the battery.
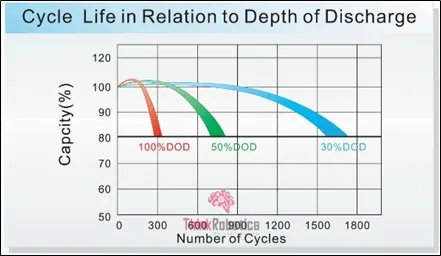
It can be observed from the above plot that, when several batteries are considered with different Depths of Discharge %, the one with the highest percentage that promises a longer one-time charge period has the least cycle life. and it becomes exactly the opposite when we are ready to give up on the DoD %; we are returned with the highest possible cycle life for that capacity. That means DoD% and cycle life of battery come at the cost of each other.
SIMULINK MODEL
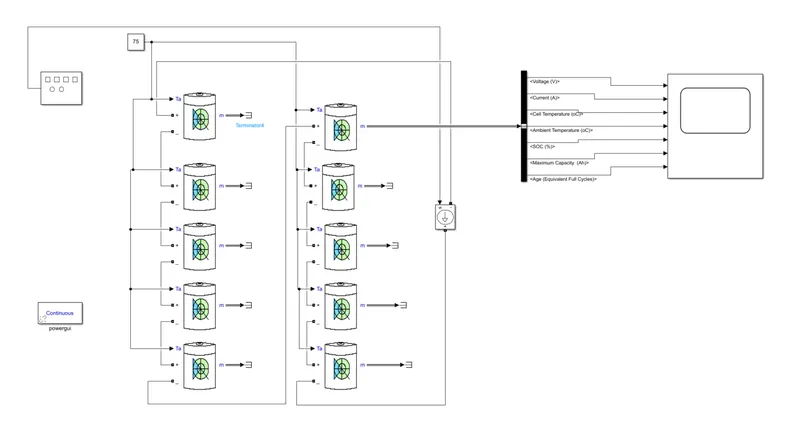
- A Generic Battery block is used to create a battery pack of 10S1P configuration.
- The external ambient temperature signal provided to the battery block is varied accordignly.
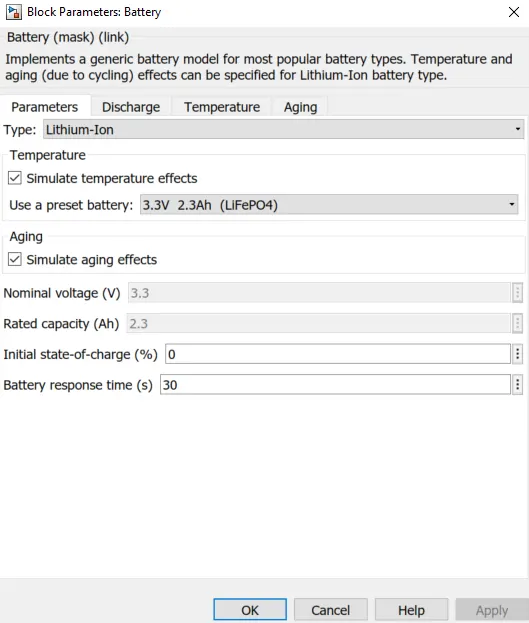
- We have considered a preset lithium-ion cell ie LiFePO4 with nominal voltage of 3.3 V and rated capacity of 2.3 Ah.
- The initial state of charge (SOC) has been set to 0 %.
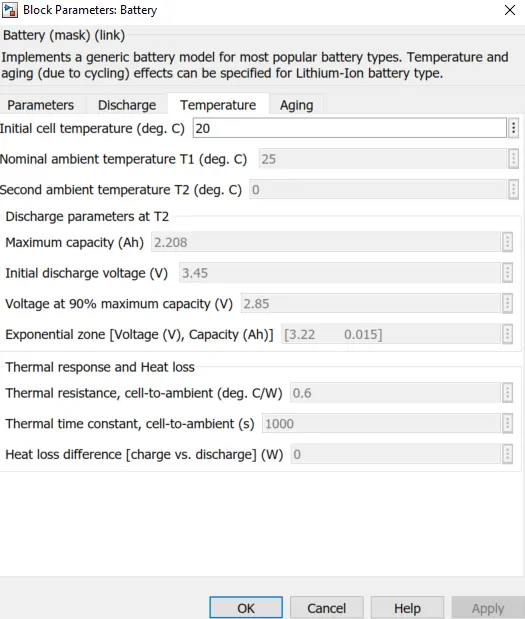
- The temperature and aging effects have been considered.The battery discharge and temperature charateristics have been set to default.
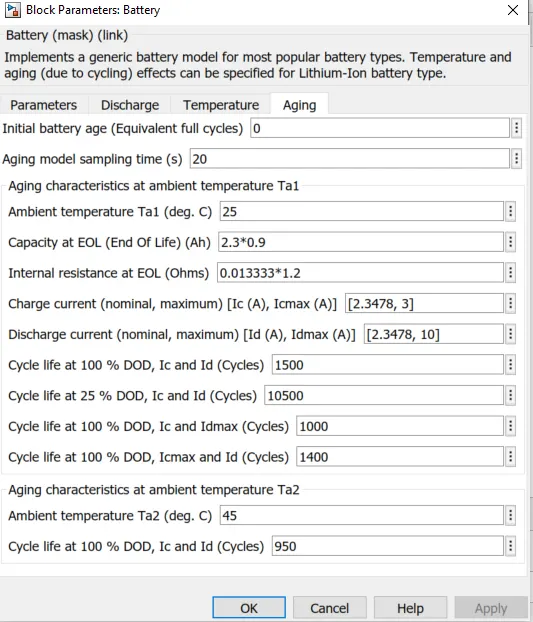
- Under the aging effects, the Aging model sampling time has been set to 20 seconds.Also the nominal charge and discharge current have been set to 2.3 A.
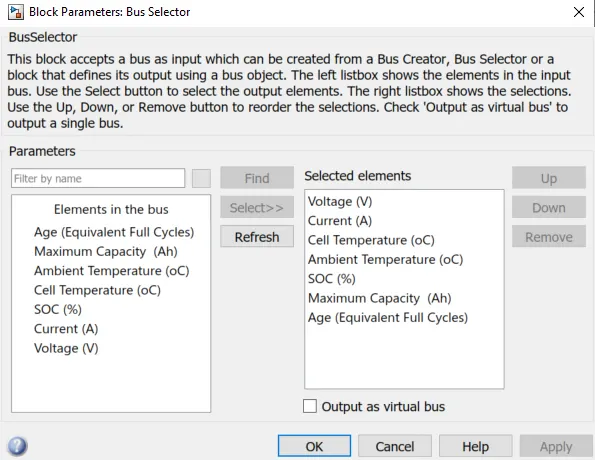
- Modelling is done with 10 cells are in series and 1 cell in parallel.
- Since there are 10 cells in series, the terminal voltage will be 10*3.3 = 33 V.
- The total battery pack capacity is determined by multiplying the number cells present in parallel with their rated capacity.ln our case since there is only 1 cell in parallel, the pack capacity will be 12.3 = 2.3 Ah.
- A Voltage Measurement block is connected between the positive and negative terminals of the battery pack, which helps in determining the battery pack voltage.The output of this block is attached to a Scope to visualise the terminal voltage of the battery pack.
- The output signal from one of the Generic Battery block in the battery pack is connected to a Bus Selector to determine the Current (A), SOC (%), Age (Equivalent life cycles), Maximum Capacity (Ah), Ambient Temperature (C), and Cell Temperature (C) of the whole pack which is visualised using a Scope block.
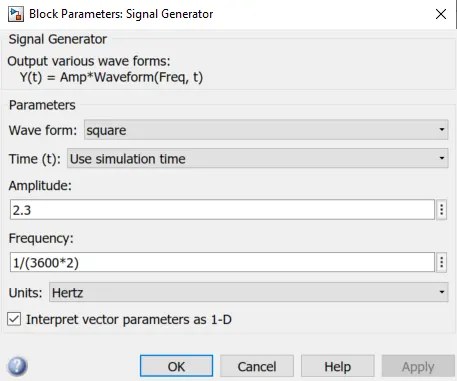
- Now in order to charge and discharge the battery pack, we have used a Square Wave Generator block.This block generates a square wave of required amplitude which translates to the magnitude of the charge and discharge current.
- Since it is a square wave, the charge and discharge current will be similar.The frequency of the wave has been set to '1/(2*3600): which translates that both charge and discharge cycles are carried out for 1 hour each.Also the unit of frequency has been changed to Hertz.
OBSERVATIONS & INFERENCE
CASE 1 - AT C CHARGE AND DISCHARGE RATE
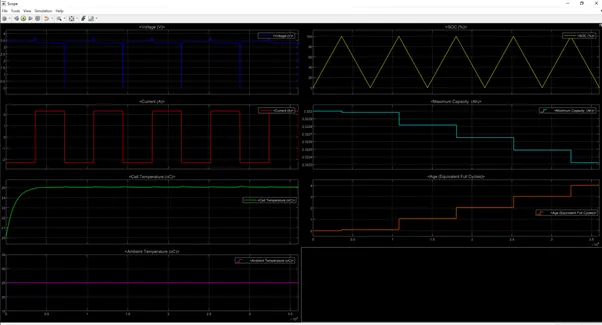
1A) AT 25 DEGREES
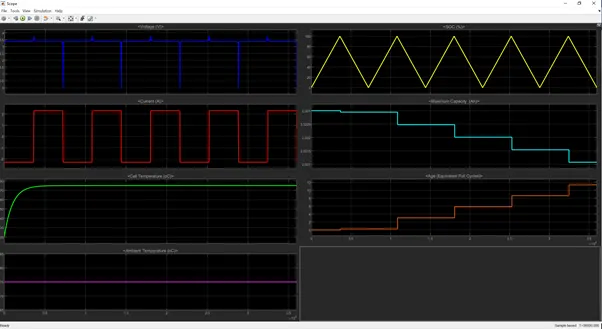
1B) AT 75 DEGREES
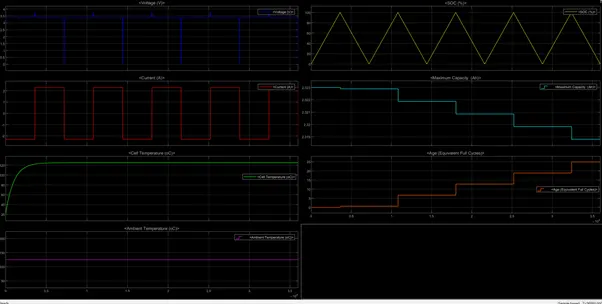
1C) AT 125 DEGREES
RESULT 1
- For all above simulation the charge and discharge rate is set to C rate abut the temperature is varied from 25 ot 75 to 125 degrees.
- When the temperature is varied there is significant change inthe life cycle of the battery .
- Volage value is 3.3 with spikes in between the cycle , max capacity is degrading from 2.3, current is constant in accordance to the input cycle at value of 2.3A , and life cycle is changing from value of 4 (at 25 degrees) to 12 (at 75 degrees) to 25 (at 125 degrees) for the same time period, it shows the effect of rise in temperature on life cycle of battery.
CASE 2 ) AT 2C CHARGE AND DISCHARGE RATE
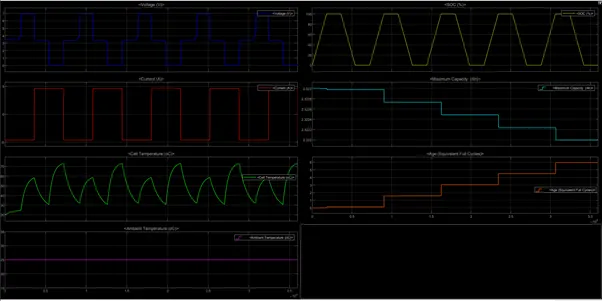
CASE 2A - AT 25 DGREEES
CASE 2B - AT 75 DGREEES
CASE 2B - AT 125 DGREEES
RESULT 2
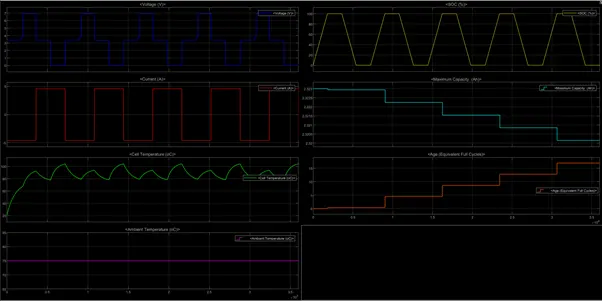
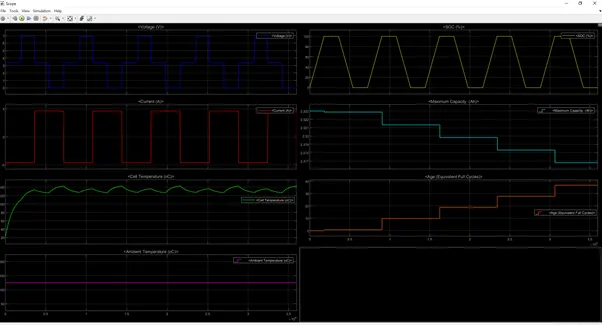
- For all above simulation the charge and discharge rate is set to 2C rate abut the temperature is varied from 25 ot 75 to 125 degrees.
- When the temperature is varied there is significant change inthe life cycle of the battery .
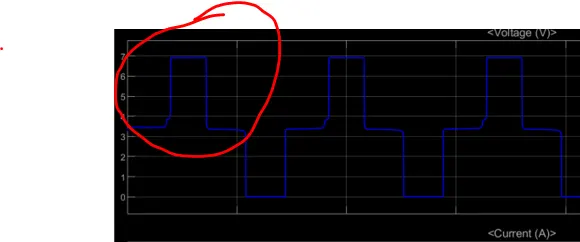
- Volage value is 3.3 with increase in max value to 7V for a duration of few seconds in between the cycle
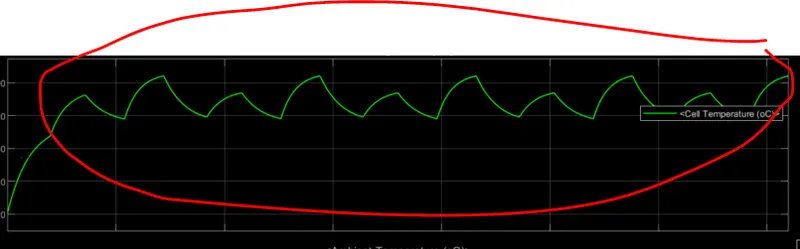
- the temperature is not constant unlike the other simulation and is fluctuating between the values
- max capacity is degrading from 2.3, current is constant in accordance to the input cycle at value of 5 A , and life cycle is changing from value of 1.5 (at 25 degrees) to 6 (at 75 degrees) to 18 (at 125 degrees) for the same time period, it shows the effect of rise in temperature on life cycle of battery
CASE 3 ) AT 0.5 C CHARGE AND DISCHARGE RATE
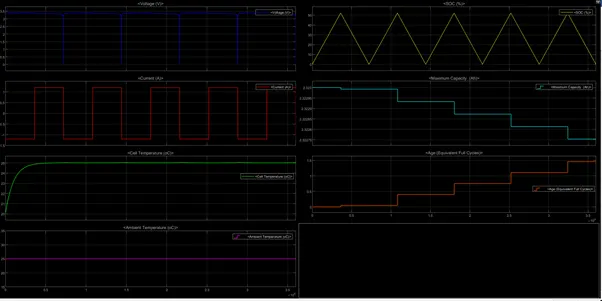
CASE 3A - AT 25 DGREEES
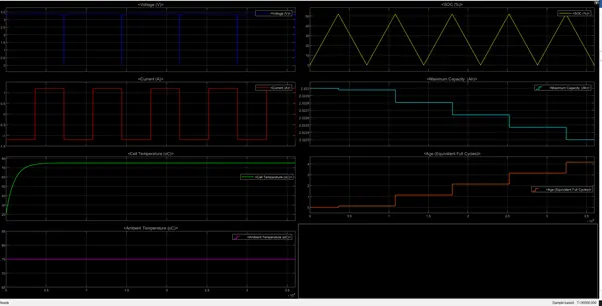
CASE 3B - AT 75 DGREEES
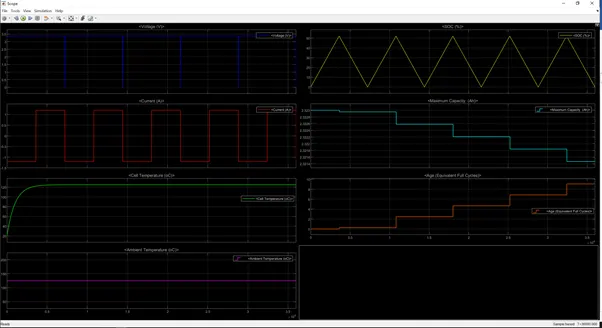
CASE 3C - AT 125 DGREEES
RESULT 3
- For all above simulation the charge and discharge rate is set to 0.5 C rate abut the temperature is varied from 25 ot 75 to 125 degrees.
- When the temperature is varied there is significant change inthe life cycle of the battery .
- Volage value is 3.3 with almost no spike in between the cycle
- max capacity is degrading from 2.3, current is constant in accordance to the input cycle at value of 1.2 A , and life cycle is changing from value of 1.5 (at 25 degrees) to 4 (at 75 degrees) to 9 (at 125 degrees) for the same time period, it shows the effect of rise in temperature on life cycle of battery