Week-3 Challenge: ADVISOR Tool
1)
Simulation of EV_default using ADVISOR tool is shown below
Case 1) For default cargo mass of 136 kg
With default battery value of ESS_PB25 ,
First of all select the required model from drop down list of LOAD FILE
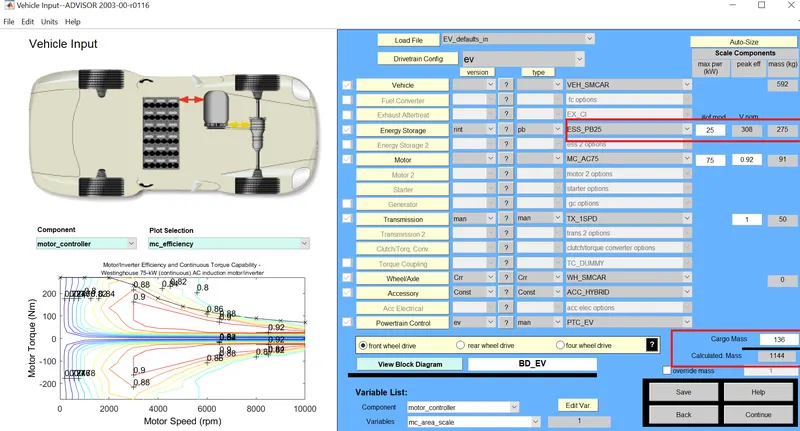
Then press the continue button of the window
- After that select the needed drive cycle from the DRIVE CYCLE drop down menu
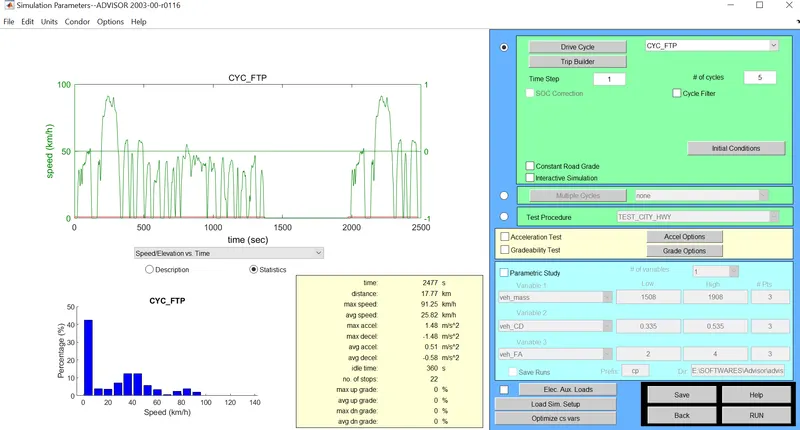
Using the drive cycle of FTP for 5 cycles
Then according to the requirement select the no of cycle
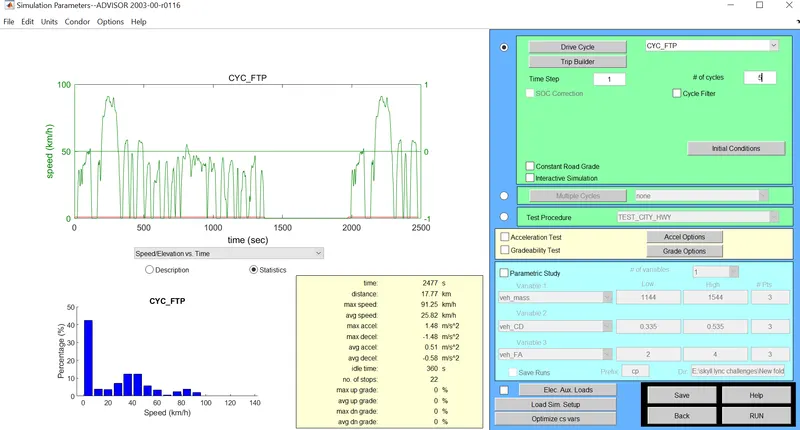
- After that select the RUN button to start the simulation
Following result is obtained
- If a particular parameter variation is to be plotted , then ,from the component menu select the component for display then using the plot variable menu select the parameter needed to be plotted
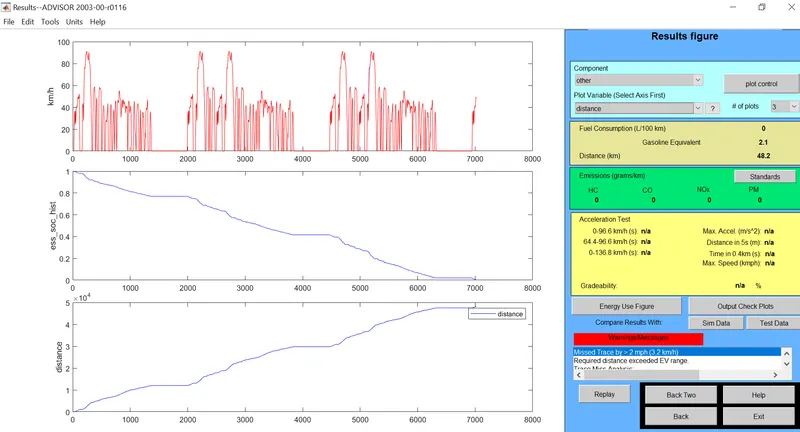
So we can see
1) the distance travelled is 48.2 km before the battery is depleted to 0 value.
2) Gasoline equivalent valueis 2.1
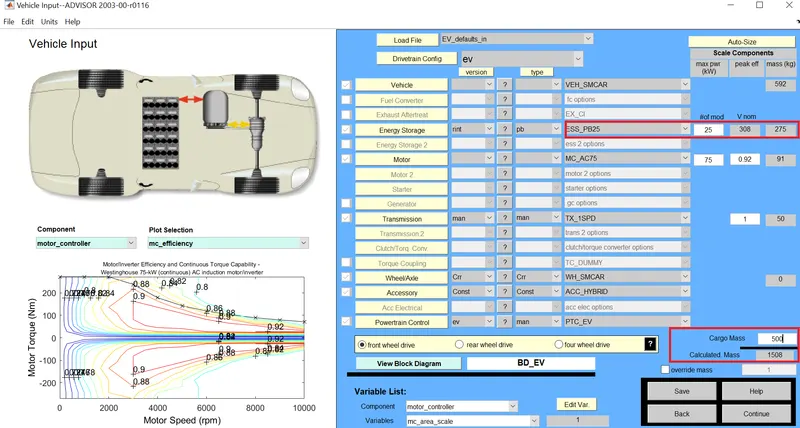
Case 2) cargo mass of 500 kg
From the drop down menu of cargo mass as higlighted , enter the required weight
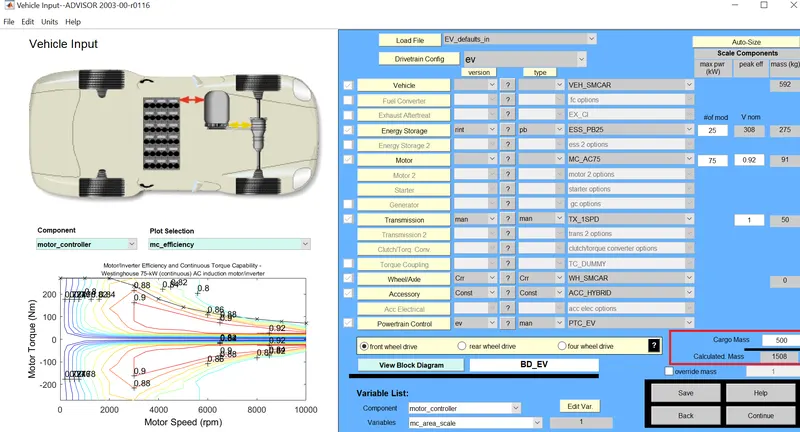
Keeping all the parameters same
with FTP DRIVE cycle for 5 times
the output obtained is
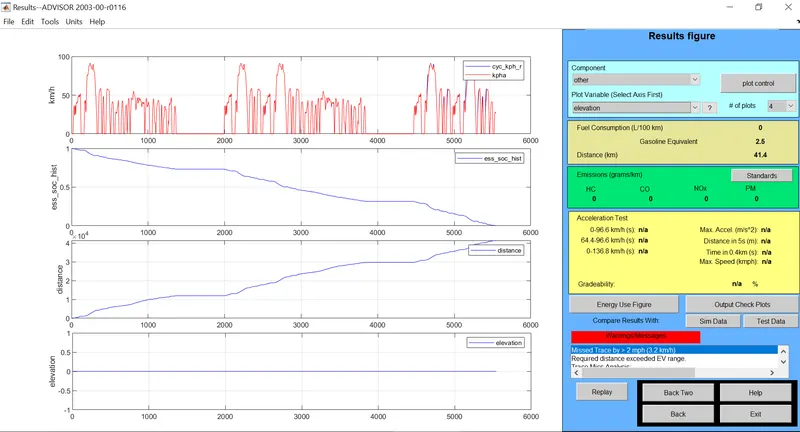
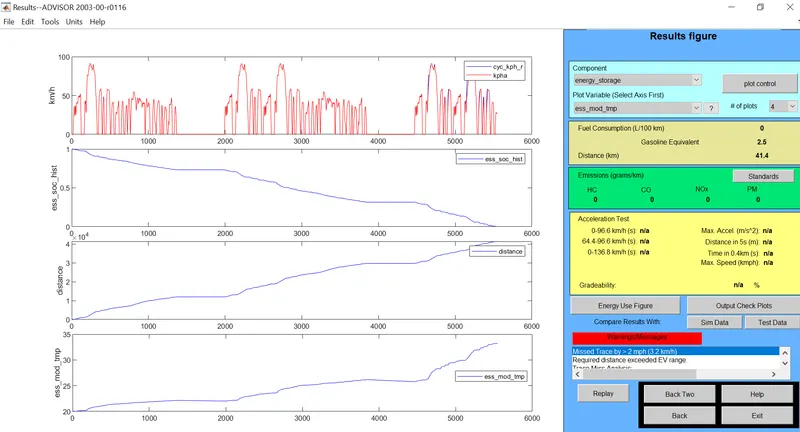
As its visible that after increase in the cargo weight the distance travelled by the vehicle has reduced to 41.4 km and the power consumption has increased to gasoline equivalent of 2.5 value.
So after increasing the cargo weight to 500 kg vehicle cannot travel 45 km before getting depleted of charge.
------------------------------------------------------------------------------------------------------------------------------
2)
For this part we will be changing the cargo weight as well as the battery capacity and observe the change
CASE 1) CARGO WEIGHT OF 136 Kg
CASE 1A) Using the default battery of ESS_PB25
USING THE FTP DRIVE CYCLE FOR 5 REPEATITIONS FOR ALL CASES
the results obtained is
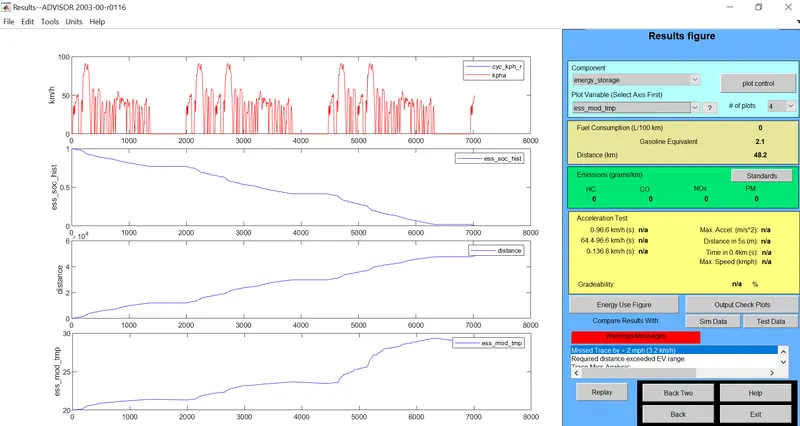
It can be deduced that at 0 charge point the distance travelled is 48 km and the battery module temperature rises to an approx value of 28-29 degree celcius.
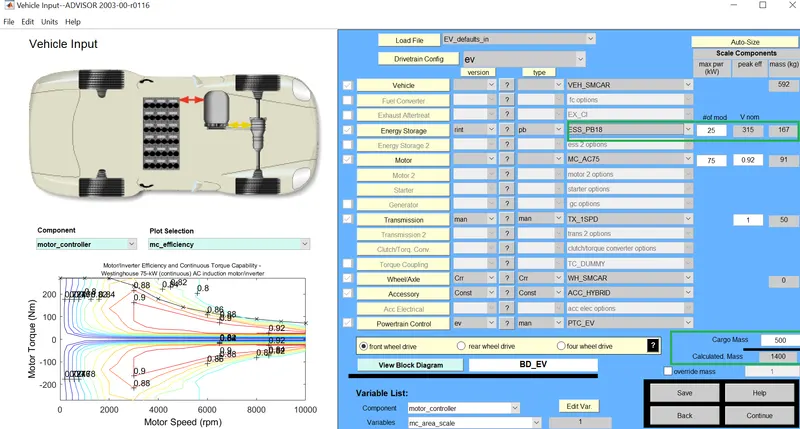
CASE 1B) Using the battery of ESS_PB18 -
From the drop down menu of Energy Storage as higlighted , select the required battery variant
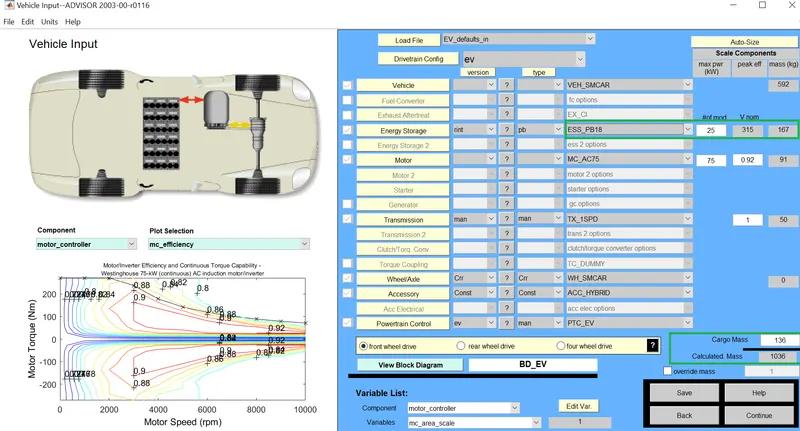
WITH change in battery capacity the mass of vehicle has also changed. After simulation the result is
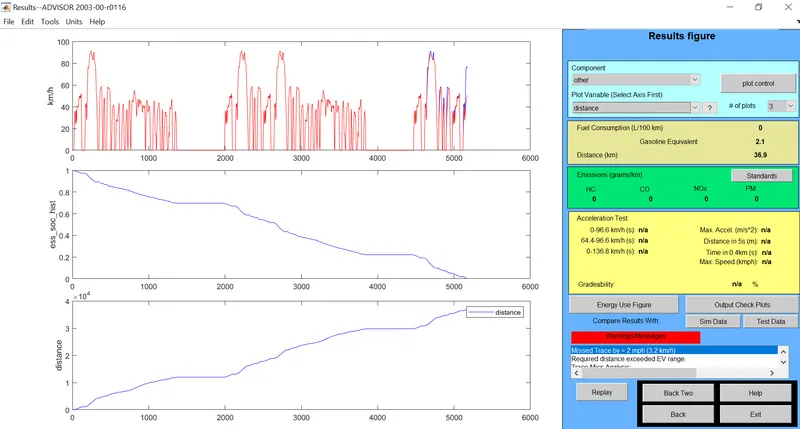
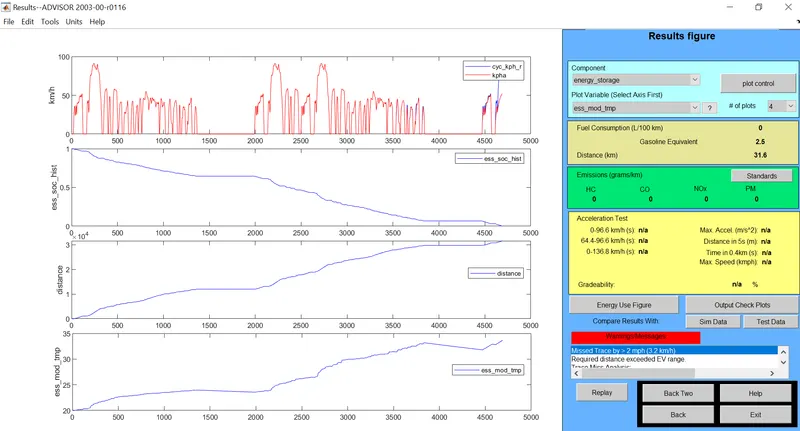
It can be deduced that with change in battery capacity the distance travelled before getting depleted has been reduced in comparison to the PB25 battery.
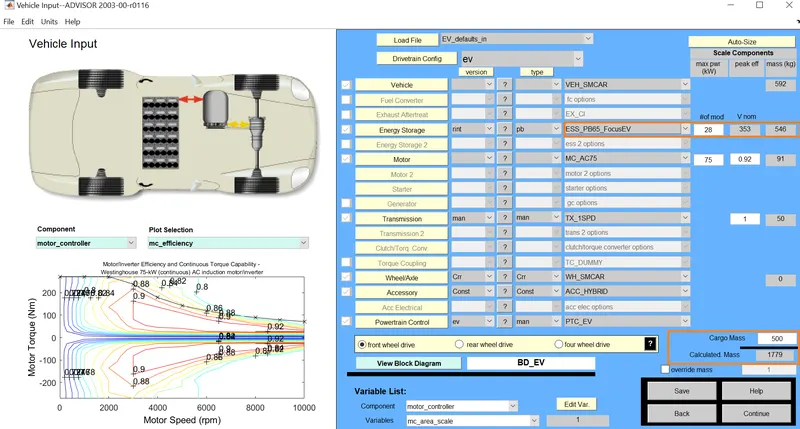
CASE 1C) Using the battery of ESS_PB65 -
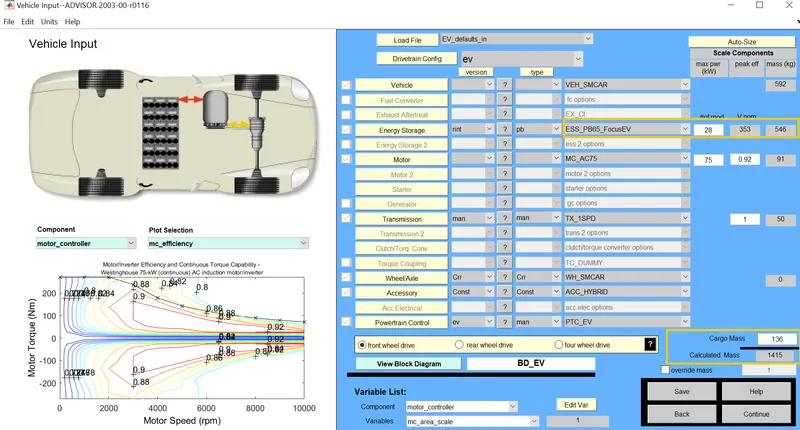
Keeping drive cycle same , the result of simulation is
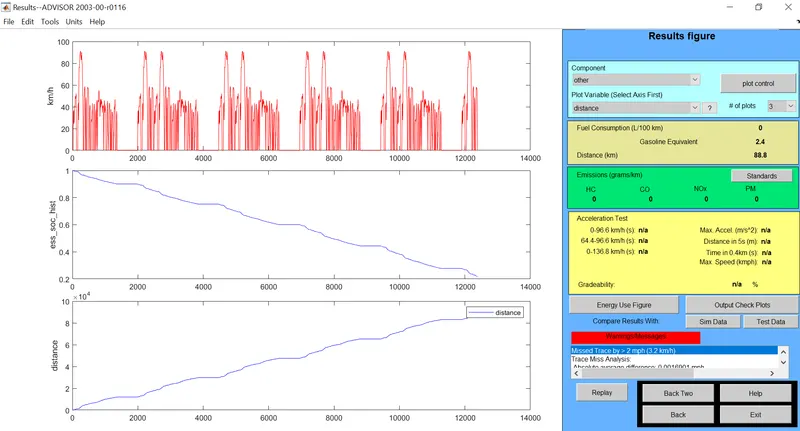
It can be deduced that with change in battery capacity the distance travelled before getting depleted has been increased in comparison to the PB25 battery.
Case 2) Cargo weight of 500 kg
CASE 1A) Using the default battery of ESS_PB25
Result of simulation
CASE 2B) Using the battery of ESS_PB18 -
THE RESULT OBTAINED IS
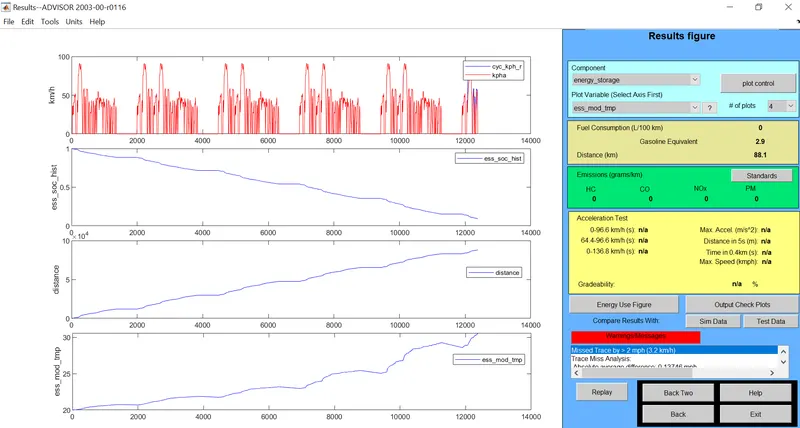
CASE 2C) Using the battery of ESS_PB65 -
RESULT OBTAINED IS
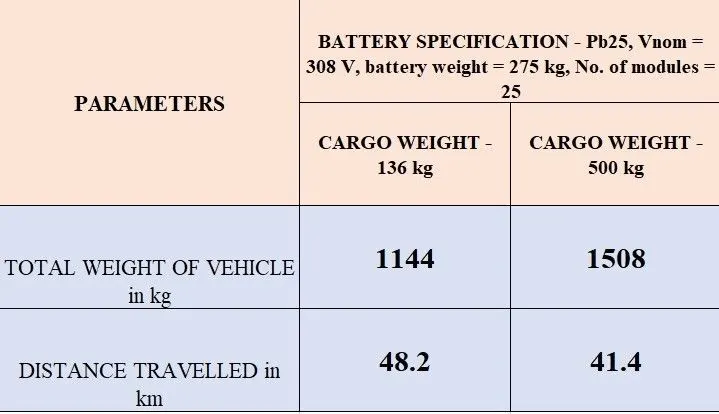
SO FOR THE ABOVE SIMULATION THE CONSOLIDATED INFERENCE THAT CAN BE OBTAINED IS AS FOLLOWS
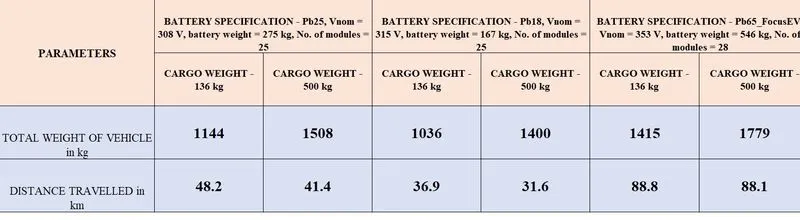
With increase in load the total distance travelled decreases.
3)
GRADEABILITY TEST WITH PRIUS_JPN_DEFAULTS_IN FILE
For performing this simulation first of the prius model is selected
After selecting the model then the parameters are set
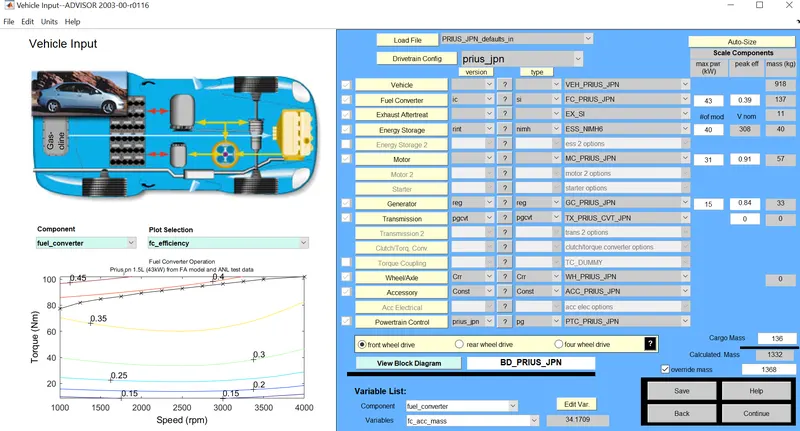
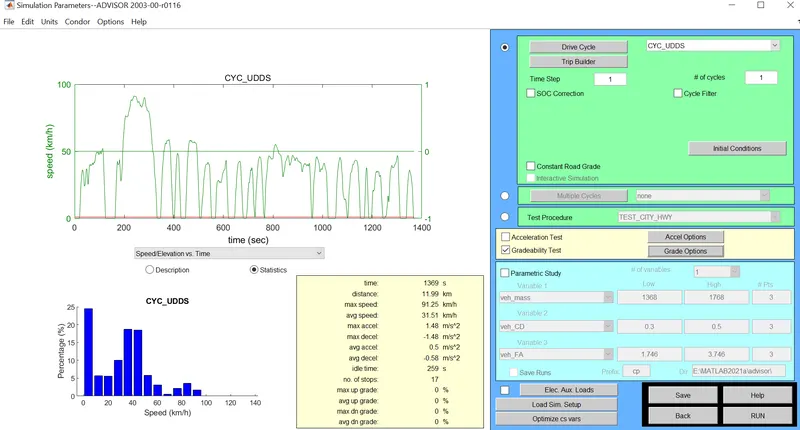
Drive cycle selected is UDDS with 1 cycle of test
- Then we enable the gradibilty test by ticking the gradebility dialogue box.
- Then by selecting the grade option we get the window for changing the values
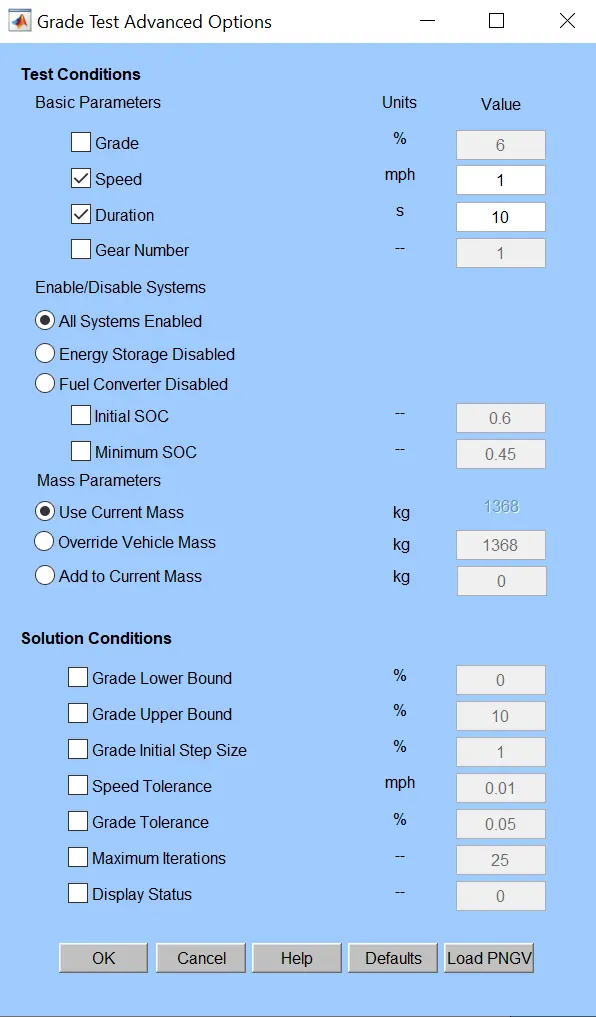
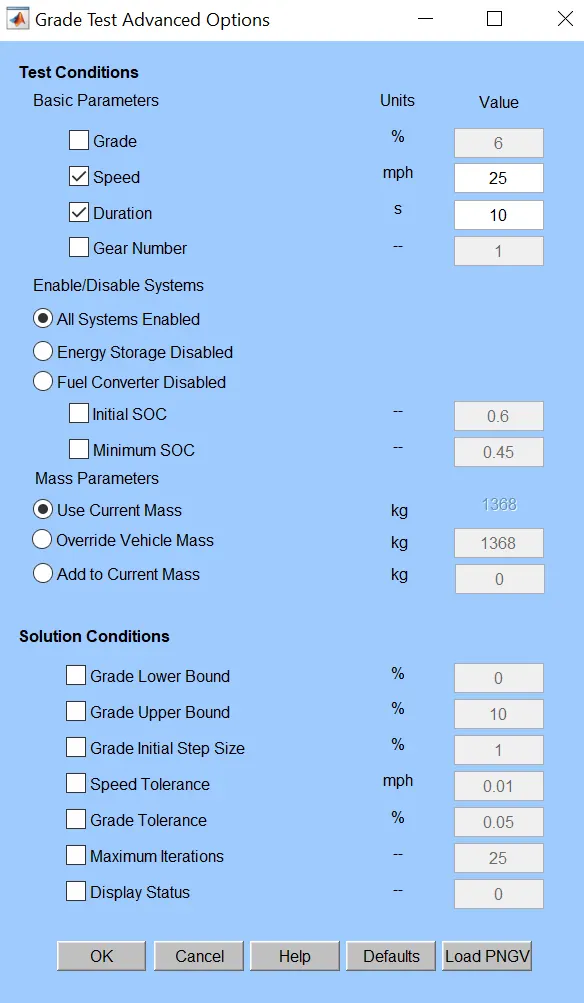
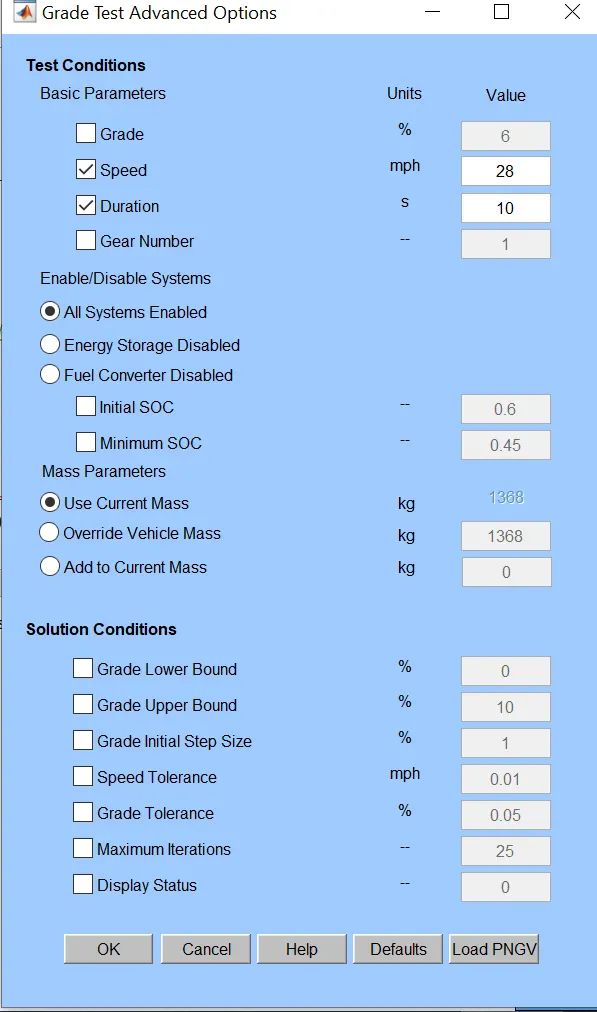
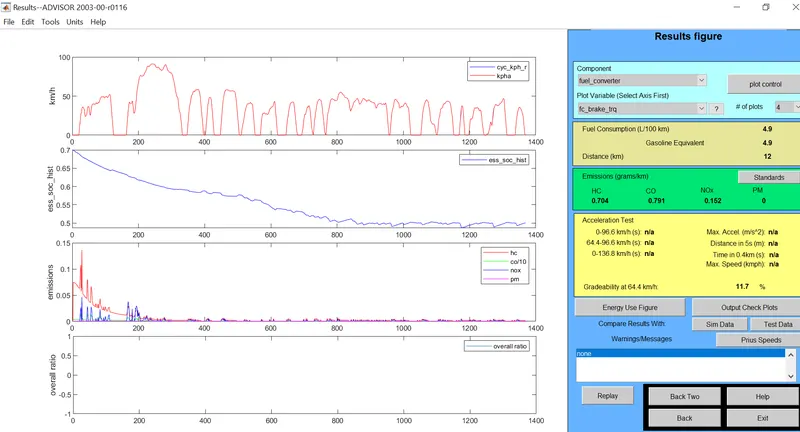
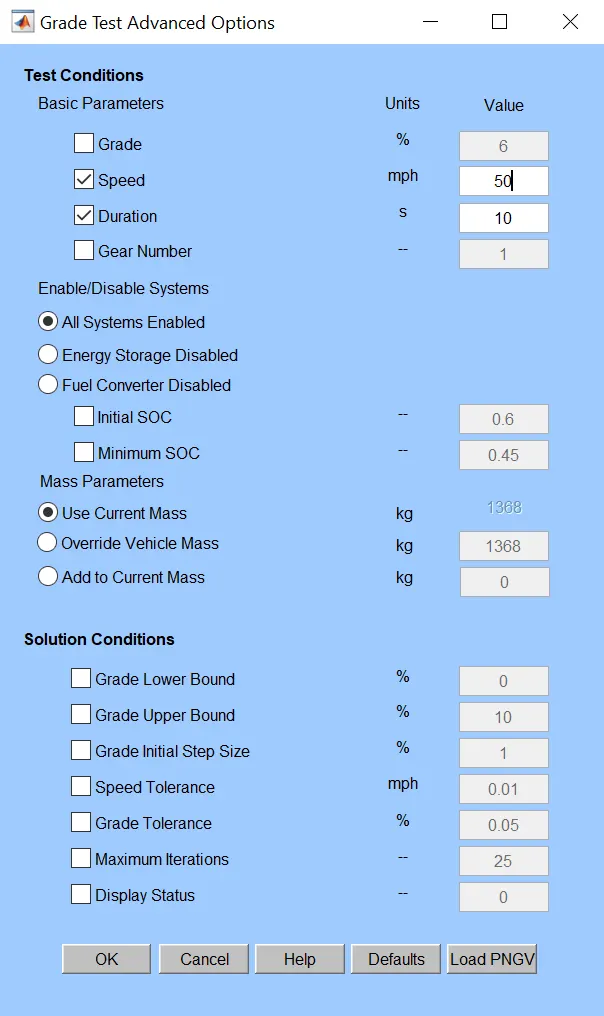
Grade value is kept at 6 and velocity values are changed
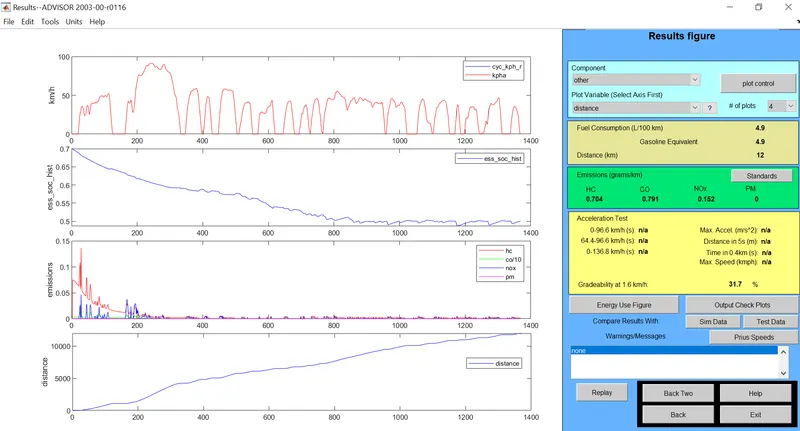
1) velocity = 1 mph or 1.6kmph
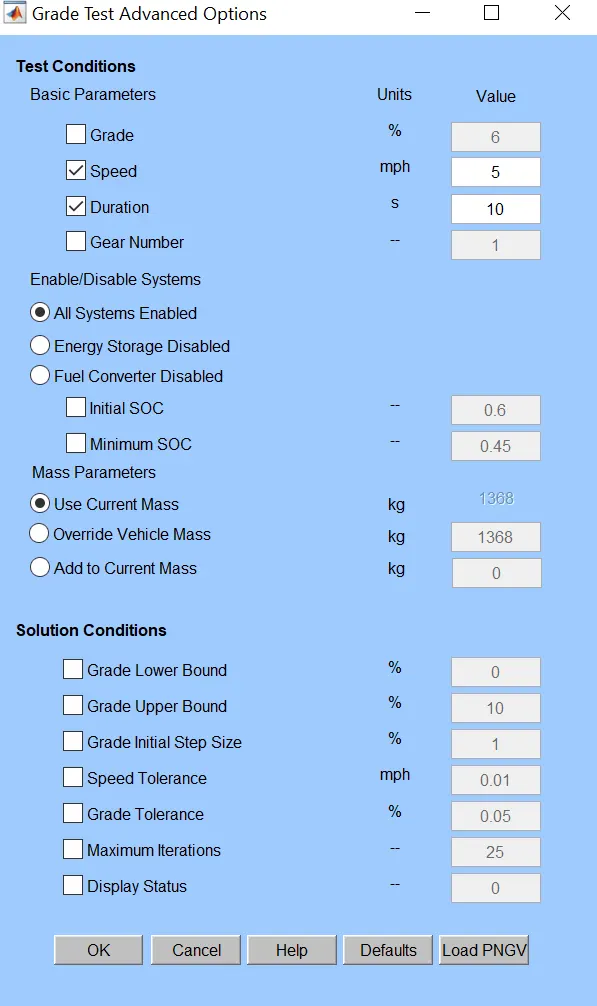
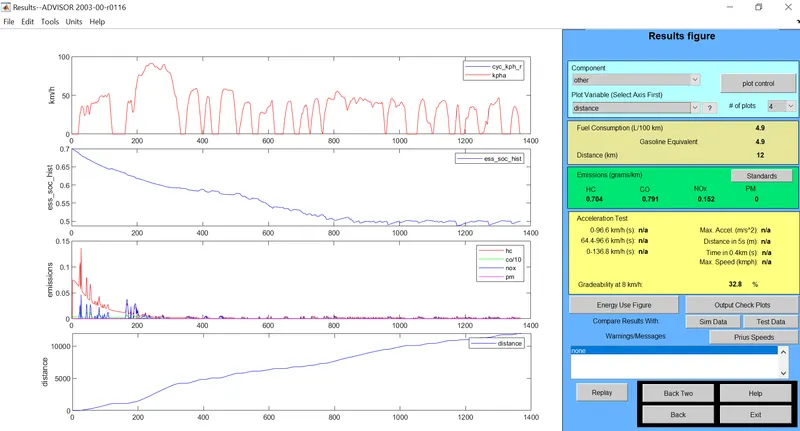
2) velocity = 5 mph or 8 kmph
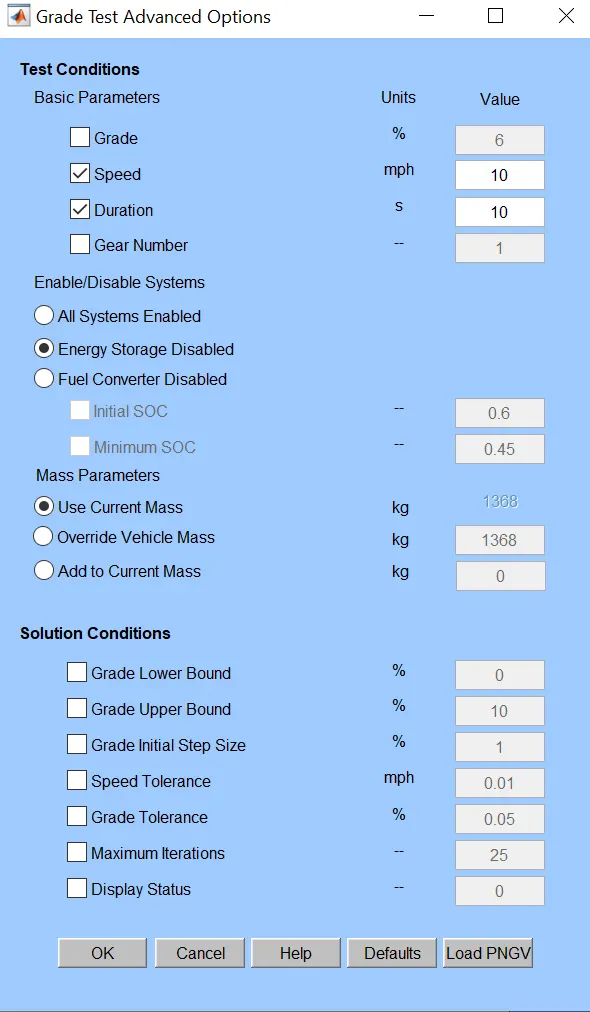
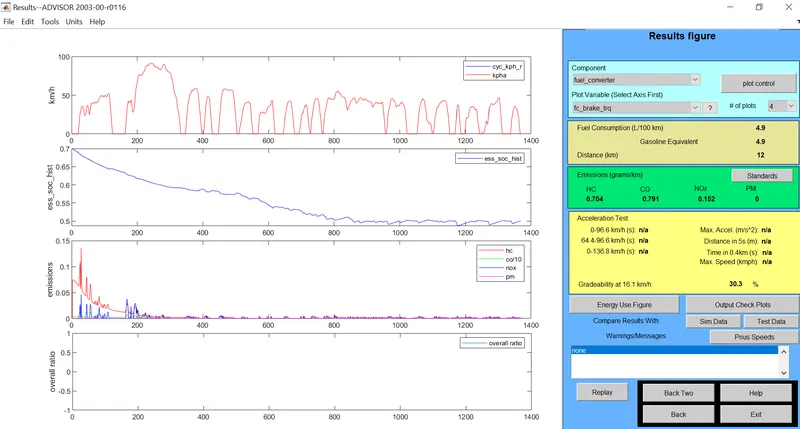
3) velocity = 10 mph or 16.1kmph
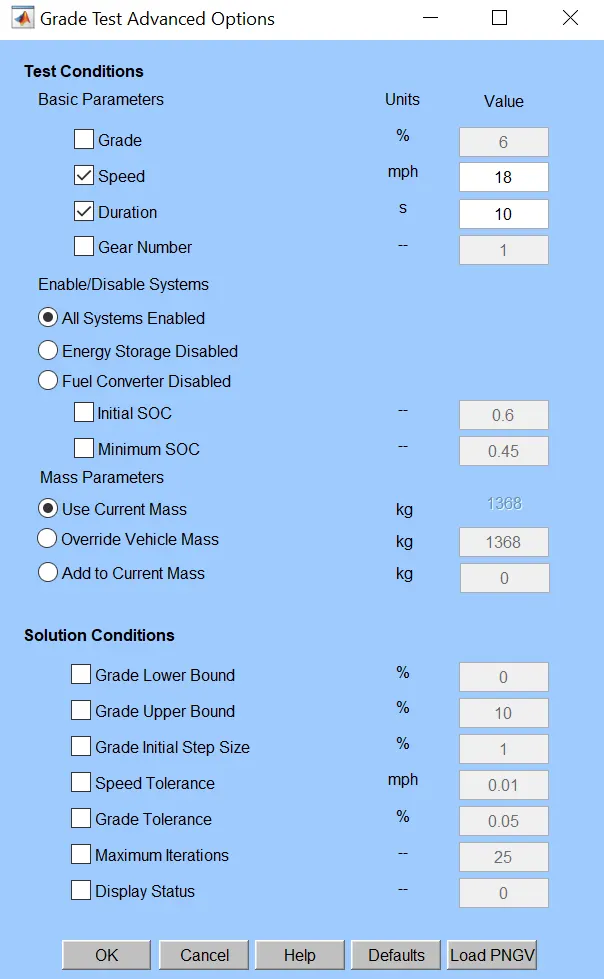
4) Velocity = 18 mph or 29 kmph
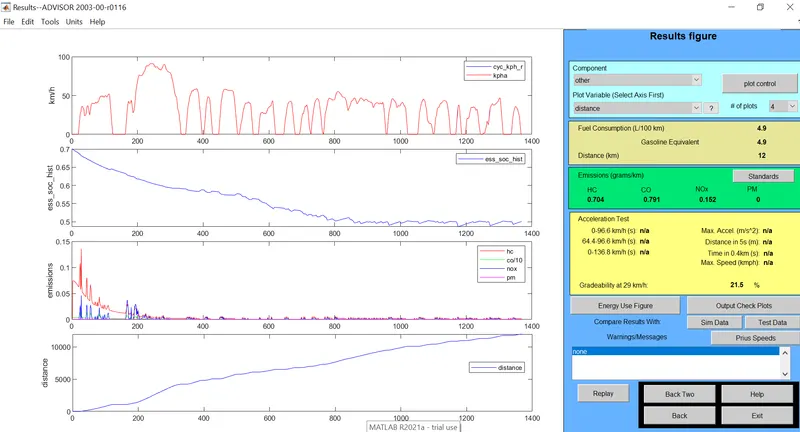
4) velocity = 25 mph or 40.2 kmph
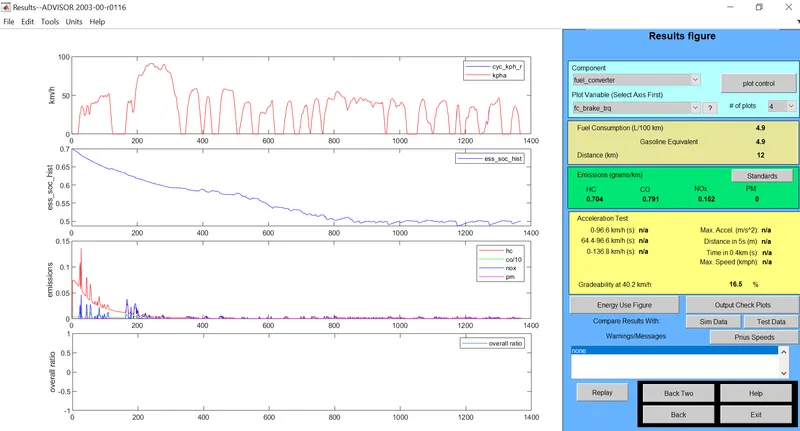
5) Velocity = 28 mph or 45.1 kmph
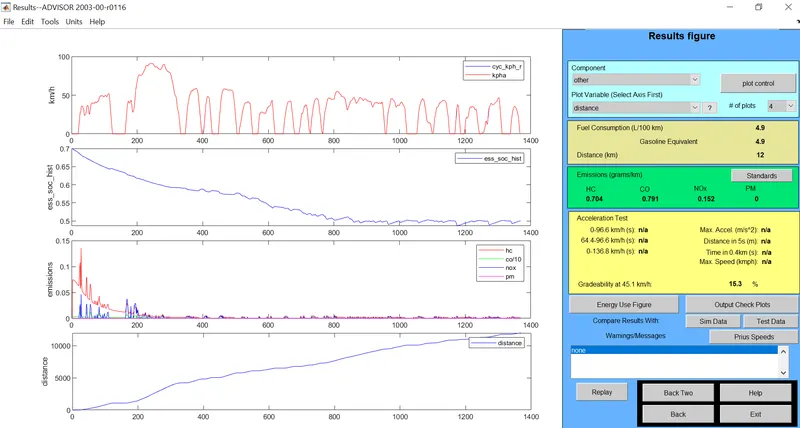
6)velocity = 35 mph or 56.3 kmph
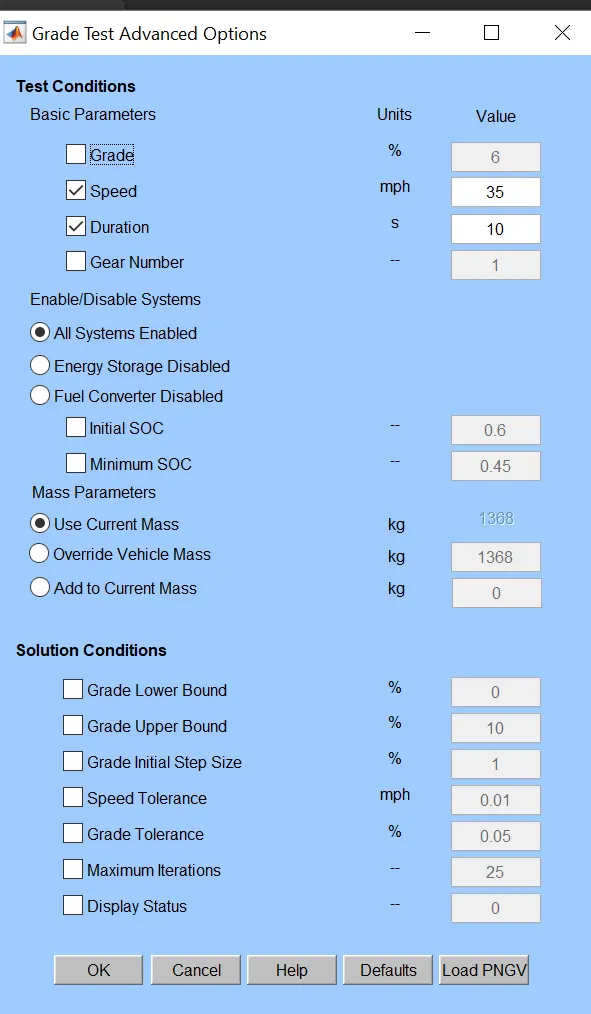
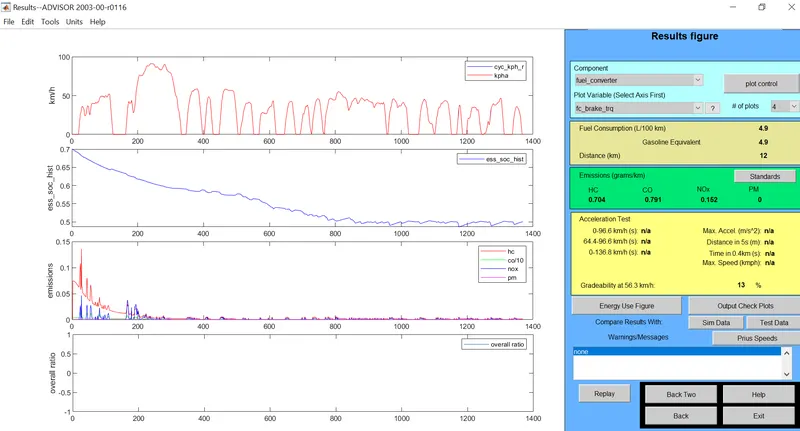
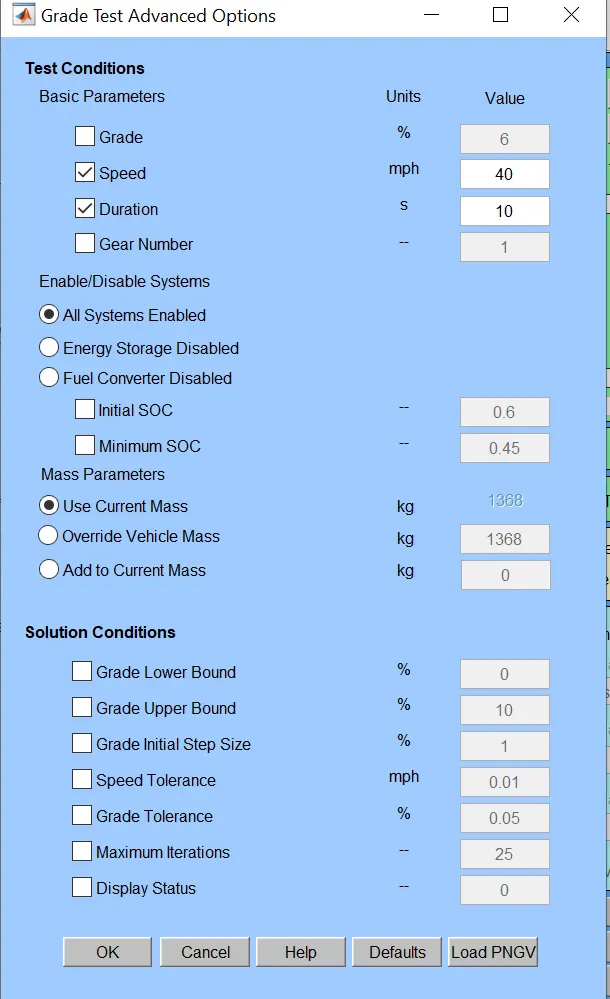
7) Velocity = 40 mph or 64.4 kmph
8) velocity = 50 mph or 80.5kmph
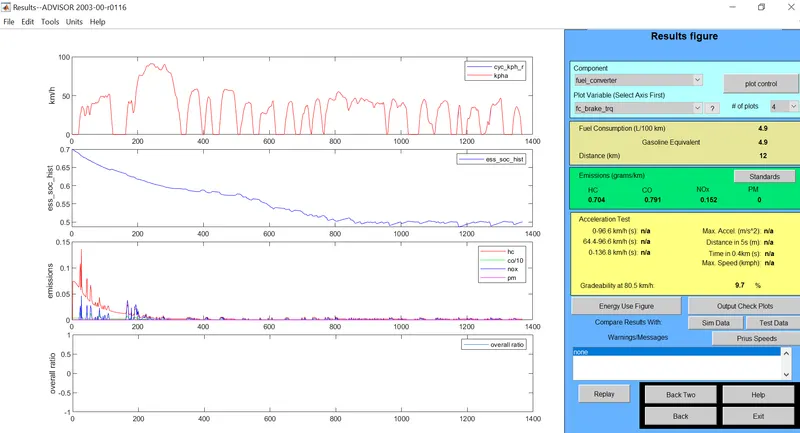
It can be deduced that keeping the grade constant and varying the velocity the gradebility changes.
| GRADE | VELOCITY(mph) | VELOCITY(kmph) | GRADEABILITY |
| 6 | 1 | 1.6 | 31.7 |
| 6 | 5 | 8 | 32.8 |
| 6 | 10 | 16.1 | 30.3 |
| 6 | 18 | 29 | 21.5 |
| 6 | 25 | 40.2 | 16.5 |
| 6 | 28 | 45.1 | 15.3 |
| 6 | 35 | 56.3 | 13 |
| 6 | 40 | 64.4 | 11.7 |
| 6 | 50 | 80.5 | 9.7 |
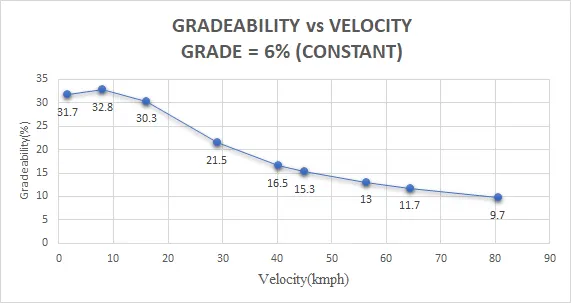
From the graph we can deduce that with grade as constant and velocity on the rise , the gradibilty decreases.