Project 2 Thermal modeling of battery pack
The objective is to create a 10 cell series Lithium ion battery model and simulate the thermal effetcs to observe and compare the life cycle performance at different temperatures, charge and discharge rates using matlab model.
Assumptions:
Let the performance of battery is based on Temperature, Charge/discharge currents & number of cycles.
- Temperature - the battery is given with 3 temperature levels at different times in simulation to know the temperature effect on battery performance and aging. And the temperature levels are taken as Low, Nominal & High with the values as 5,25,50 respectively.
- Charge/Discharge currents - here the battery is given 2 different currents i.e., 1C and 3C rate at different times to check the battery performance where 1C & 3C rate are 5.4 & 16.2A respectively
- Number of cycles - The no. of cycles is taken by the assumptions by testing the battery subjecting it to different temperatures and currents at different times. Here let the assumptions be
|
Temperature(oC) |
Charge/discharge current(A) |
Number of cycles |
|
25 |
5.4 |
0 - 5 |
|
5 |
5.4 |
5 - 10 |
|
50 |
5.4 |
10 - 15 |
|
25 |
16.2 |
15 - 20 |
So total no. of cycles assumed are 20.
Matlab Model:
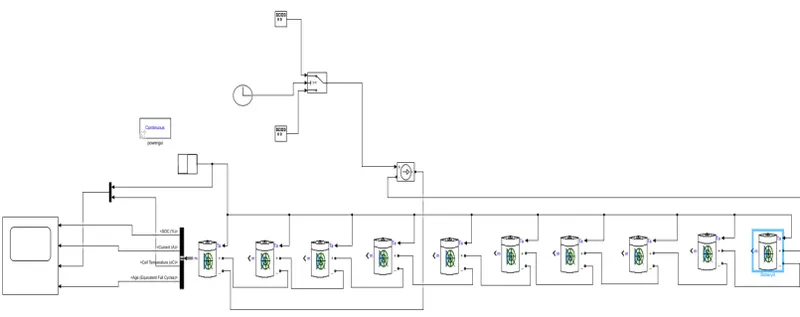
- From the above model we can observe that the 10 cells are connected in series which consist of temperature ports.
- Battery paramerters are set as default values and the age sample time is given as 20s.
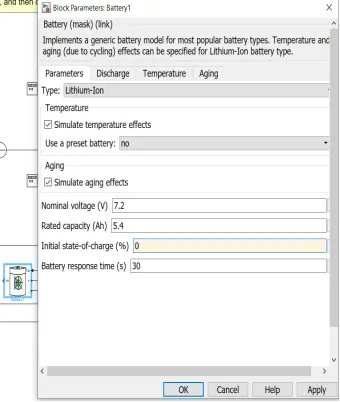
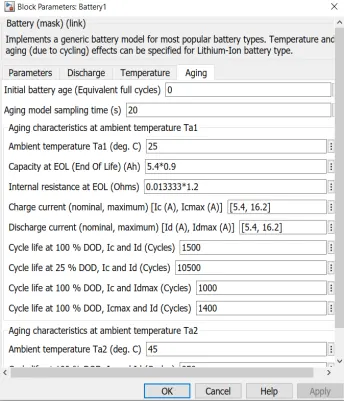
- Simulation time: The simulation time is calculated as
---> For first 5 cycles the current capacity is 1C rate for charge /discharge,
so for 1 cycle time = 2hours (Charge time + Discharge time)
Then smulation time for 5 cycles = 5*2=10hrs
---> as current capacity is same it is similar for next cycles i.e., 5-10 & 10-15 cycles
So simulation time is 10 hr for each.
---> for 15-20 cycles the current capacity is 3C so the time required will be
= (time for 1C for 5 cycles)/ 3
= 10/3 = 3.3hrs
So TOTAL SIMULATION TIME for 4 conditions = 10+10+10+3.3= 33.3hrs
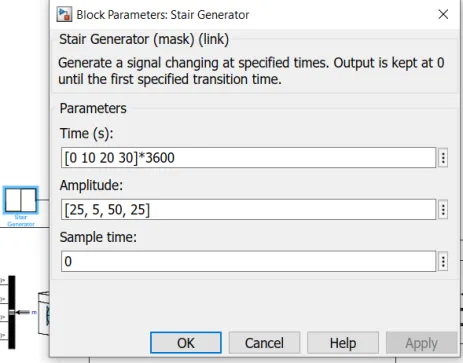
- To the temperature ports of all the batteries temperatures are given as per the above assumptions table i.e., 5,25,50 at different times is given with the help of stair generator.
- A controlled current source is connected to the pack in series through which battereies are charged/discharged at 5.4A and 16.2A for specific times as per the assumptions.
- Here Controlled current source is connected to 2 square wave generators which have amplitudes of 5.4 & 16.2 for a time period of 2hrs and 2/3hrs respectively.
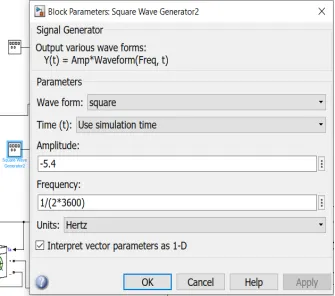
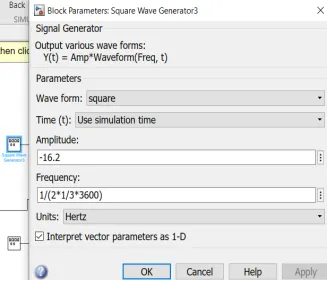
- And a switch is placed with threshold value and condition of >30hrs to give the current at required times i.e., if time is less than 30hrs 5.4A for 30hrs is switched on and if time is more than 30hrs 16.2A for 3.3hrs is switched.
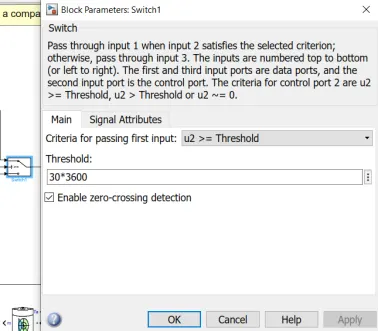
- The output taken are SOC, current, cell temperature and Age of the battery.
- Then Run the simulation for 33.3hrs and observe the results.
Results:
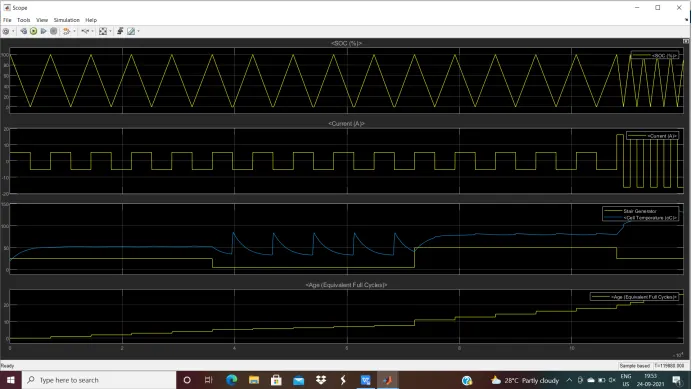
From the graph we can observe the plots of SOC, Currents, Age, cell temperature along with the ambient temperature. The plots are varying for every 5 cycles because of different conditions or assumption taken with time. So let us discuss about every 5 cycles each.
0-5 cycles: time period is 10 * 3600 sec
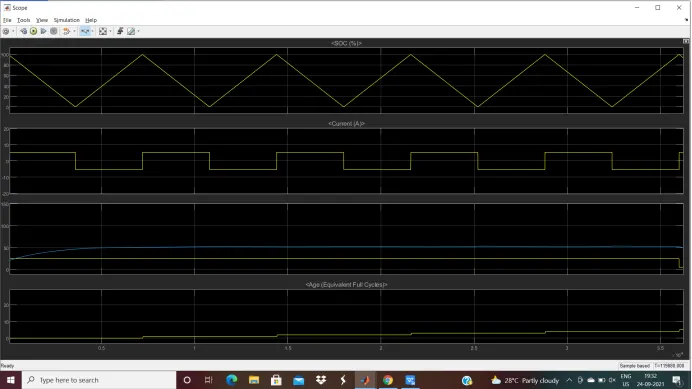
SOC: Here we can see SOC initially is 100% and it decreases when the battery is discharging and increases during charging for a period of 1hr each. So we can observe for every cycle the SOC is completely increasing and decreasing for a time period of 2hrs for each cycle.
Charge/Discharge current: here in this time we can observe current in square wave between 5.4 & -5.4A charging and discharging.
Ambient temperature: the ambient temperature given in this period is nominal temperature 25oC.
Cell temperature: Here the temperature of cell raises to around 55oC . this is because as the cell is charging the temperature is increasing.
Aging: Here we observe the aging of the battery increasing for every cycle by 1 cycle at a normal rate for this period as every parameter taken is nominal here.
5-10 cycles: time period is 10 * 3600 sec
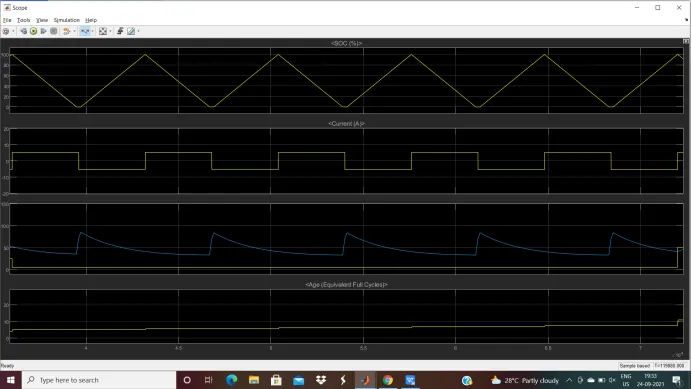
SOC: It similar to the prior cycles. So we can observe for every cycle the SOC is completely increasing and decreasing for a time period of 2hrs for each cycle.
Charge/Discharge current: This is also same as the before cycles with current in square wave between 5.4 & -5.4A charging and discharging.
Ambient temperature: the ambient temperature in this period is changed to 50C.
Cell temperature: Here in this we can observe a sudden raise and spike in temperature. This is because at low ambient temperature the resistance will be more which doesn’t allow current to increase so current must be low. But here charging current given is high for that ambient temperature. So there it leads to forceful charging with high current which leads to raise and sudden spike in temperature.
Aging: As the ambient temperature is low in these cycles the aging of the battery increases by half the value i.e., around 0.5 for every cycle with slow rate for this period. By the end it is at 7.5.
10 -15 cycles: time period is 10 * 3600 sec
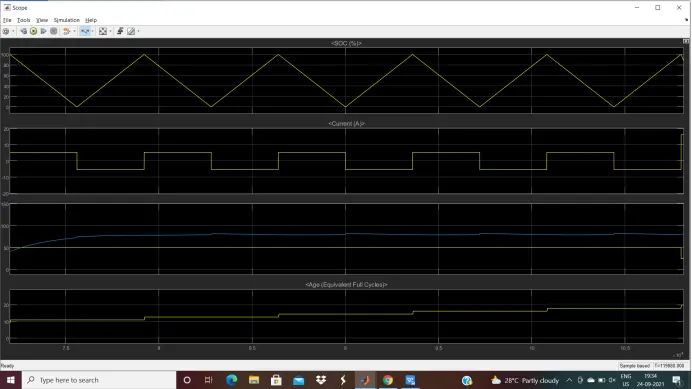
SOC: It similar to the prior cycles. So we can observe for every cycle the SOC is completely increasing and decreasing for a time period of 2hrs for each cycle.
Charge/Discharge current: This is also same as the before cycles with current in square wave between 5.4 & -5.4A charging and discharging.
Ambient temperature: the ambient temperature in this period is changed to a high value i.e., 50oC
Cell temperature: Here we can observe the temperature of cell raises further to around 80oC. This is because as cell is charges the temperature increases and the main reason was beacuse of the high value of ambient temperature.
Aging: Here we observe that as the ambient temperature is high there is big increase in aging. The aging of the battery is increased by double the value i.e., increasing by 2 cycle for every cycle of aging which is more than the normal rate for this period.
15 -20 cycles: time period is 3.3 * 3600 sec
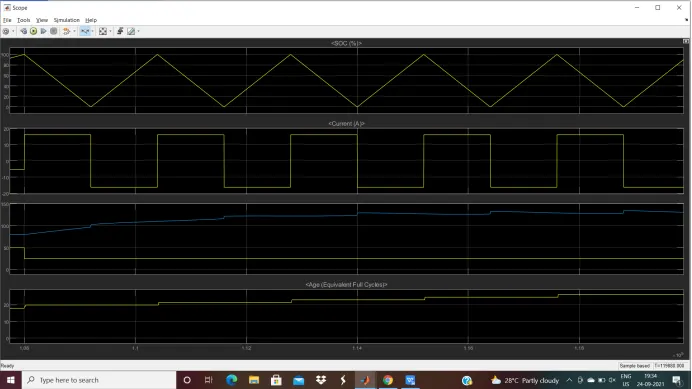
SOC: It is not similar to before cycle. So we can observe for every cycle the SOC is charging and discharging fast because of high C rate i.e., 3C rate for a reduced time period of 2/3hrs for each cycle.
Charge/Discharge current: Here current capacity is increased to 3C rate so the time period reduced and the charge and discharge current increased to 16.2A i.e., in between 16.2 & -16.2A charging and discharging.
Ambient temperature: The ambient temperature in this period is changed to nominal value i.e.,25oC.
Cell temperature: In this period the temperature has increased to more than 120oC which is a very high temperature even the ambient temperature is nominal. This is because of the high C-rate and by this we can understand that as the current value increases the temperature increases.
Aging: Here we observe that as the C-rate increased by 3 times there is increase in aging at faster rate i.e., life span is decreasing fastly. And also increasing by 1.5 for every cycle of aging at a much faster rate.
Conclusion:
Thus the battery model performance is observed at different temperatures and charge/discharge rates.