Project 2 Thermal modeling of battery pack
For a 10 cell series lithium ion battery model, simulate the thermal effects and compare life cycle performance at various temperatures, charge & discharge rates using MATLAB.
Aim: To Observe thermal effects on the 10 cells series of lithium ion battery model and compare life cycle performance at various temperatures.
Battery: Battery is a device which can store electrical energy into chemical energy at the time of charging and agian it will produce electrical energy at the time of discharging.
Working Principal of a battery:
Battery consist of anode electrode, cathode electrode and electrolyte.
Anode:
If a current enters into the ploarized device or if electron leave the electrode, then that electrode is called anode.
Cathode:
If a current leaves the ploarized device or if electron enters the electrode then that electrode is calledcathode.
Lithium atom has atomic number of 3, if it is looses one electron then it will become stable.Therfore Lithium is highly reactive element.
Lithium available in the form of Lithium-metal oxides are used in the cathode and lithium-carbon compounds are used in the anode.
Discharging
Positively charged lithium ions (Li+) move from the negative anode to the positive cathode.
They do this by moving through the electrolyte until they reach the positive electrode.
The electrons, on the other hand, move from the anode to the cathode.
Charging:
while charging a lithium-ion battery, the exact opposite process happens. The lithium ions move back from the cathode to the anode.
The electrons move from the anode to the cathode.
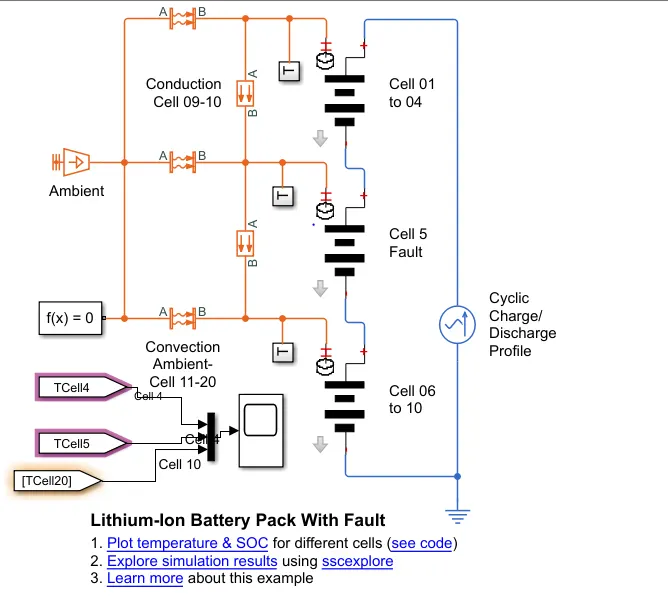
10 cell series lithium ion battery model
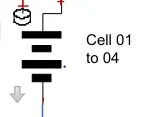
Cell:
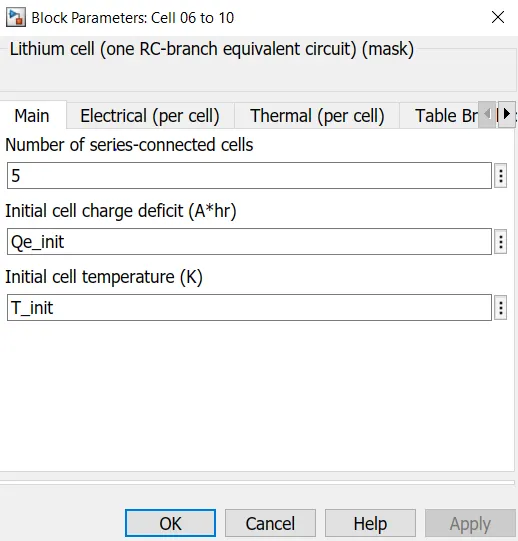
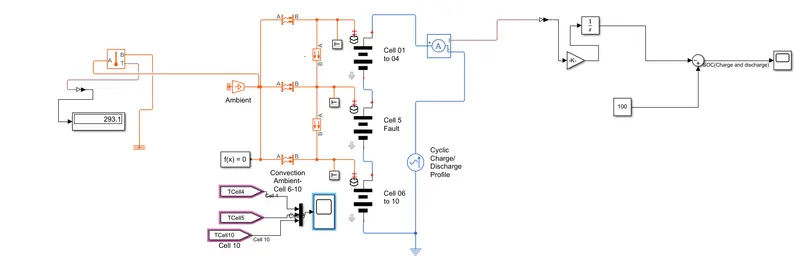
Total 10 cells are connected in series. These cells are divided into three groups.
First Group: Here 4 cells are connected.
Second Group: Here one cell is present and fault is created at this point.
Third Group: Here remaining cells are coonected.
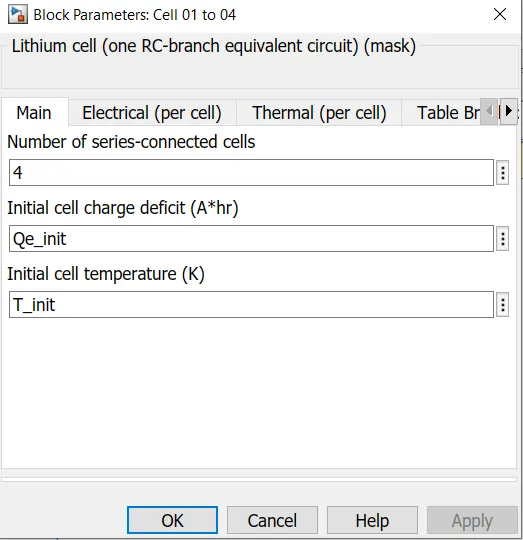
Above figure shows data of first group.
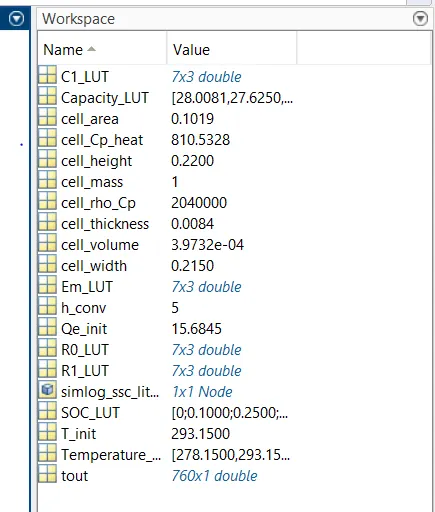
Intial charge and intial temperature data can be obtained from Workspace.
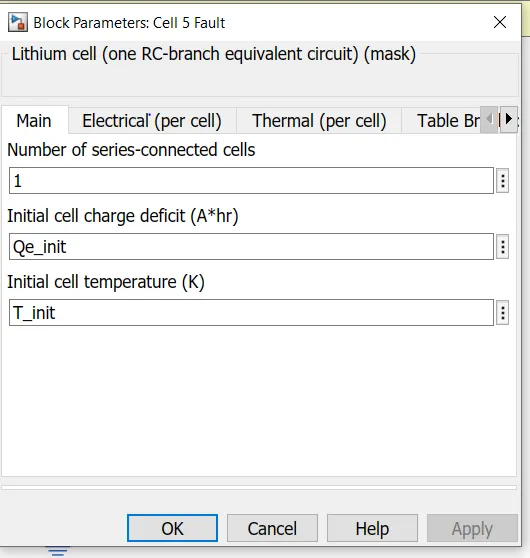
Above figure shows data of second group.
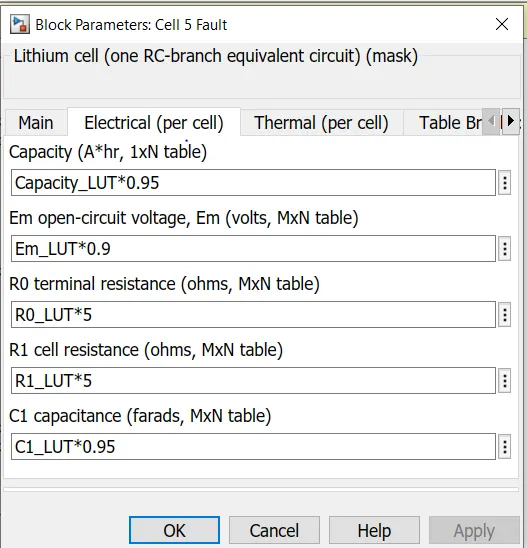
Fault is created by reducing cell capacity, open circuit voltage and capacitance of cell.
Above figure shows data of second group.
Cyclic Charge and Discharge profile:
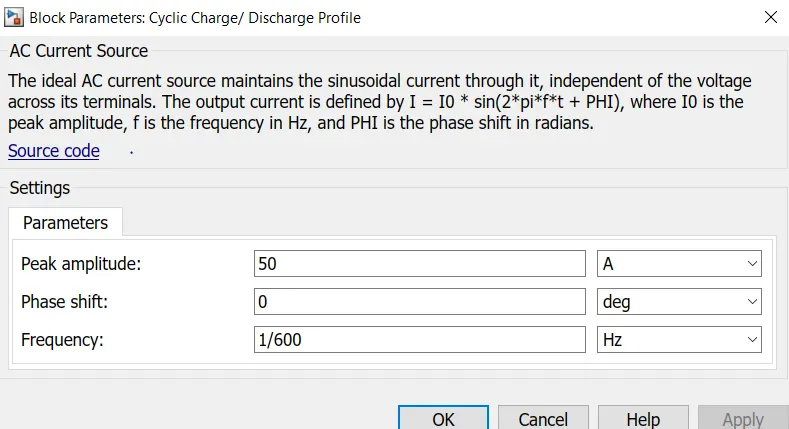
Here sinusoidal signal of having amplitude 50 and frequency 1/600Hz is created.
Convective Heat Transfer:

The Convective Heat Transfer block represents a heat transfer by convection between two bodies by means of fluid motion.
The transfer is governed by the Newton law of cooling and is described with the following equation:
Q=k·A·(TA−TB)
Q= Heat flow
A= Area of contact
TA-TB= Temperature difference
As Area contact increases heat flow of body increases.
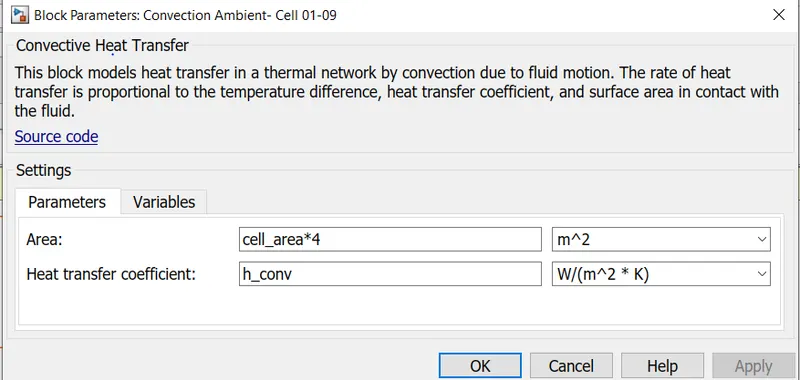
Above figure shows data of Convective Heat Transfer of first group.
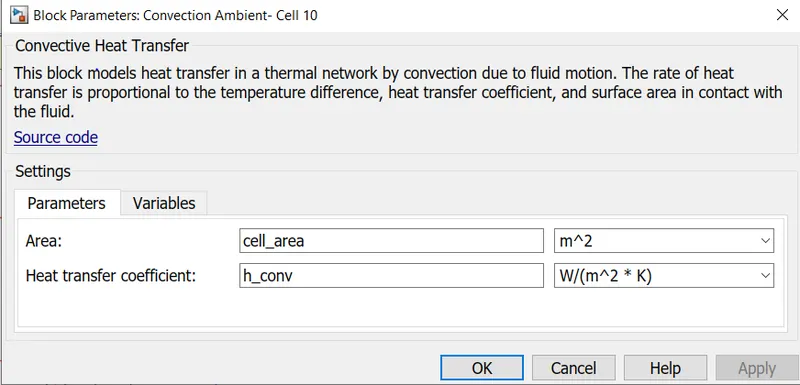
Above figure shows data of Convective Heat Transfer of Second group.
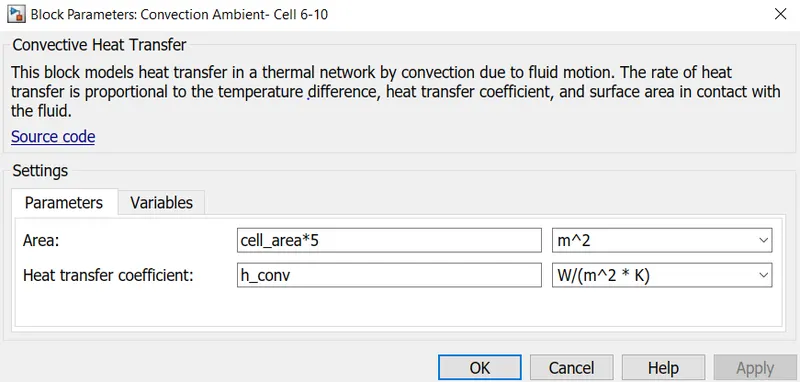
Above figure shows data of Convective Heat Transfer of Third group.
Conductive Heat Transfer

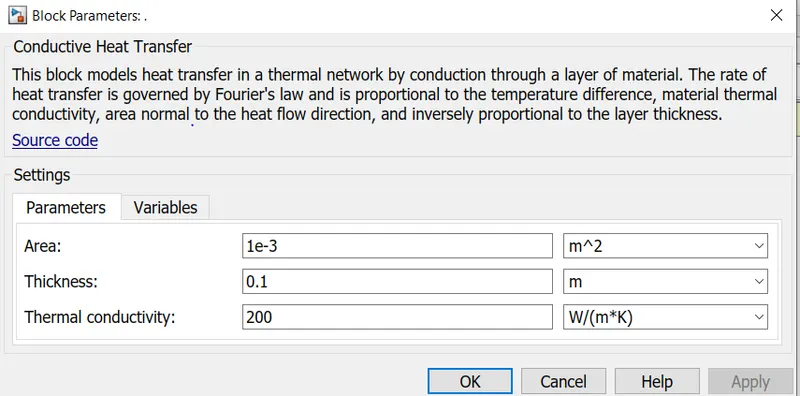
Above figure shows data of Conductive Heat Transfer of all groups.
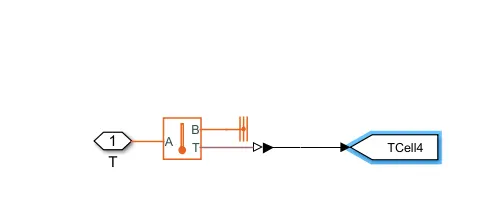
Temperature sensors
This block will help in sensing Temperature.
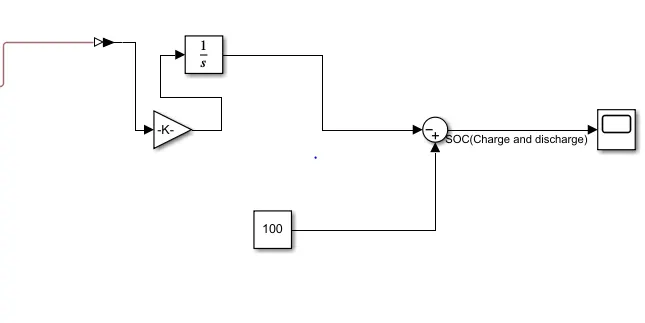
Battery Soc Caliculation
Current is sensed and integrated to get charge of a battery.
Simulink Model:
Procedure:
1:Open matalb simulink file.
2: Connect the circuit as shown in model.
3: Model is simulated for 7200 secs.
3: Save the file and compile it and obtained the results.
4: Observe the Results for various Temperatures across the cell.
5: Observer charge and discharge profile of the cells.
Data of Model is obatained from the work space as shown in below figure.
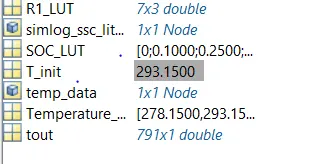
Case 1: Intial Temperature of Cells is 293.15 K
Intial temperature of battery is changed to 293.15K in workspace as shown in below figure.
Charge and Discharge profile of a cell
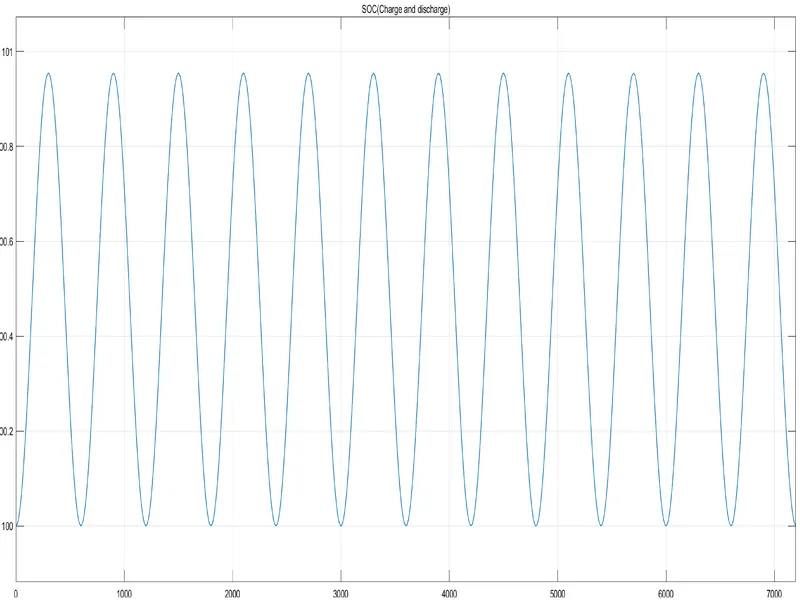
Time period of Each cycle is 720 secs.
Total 6 cycles are covered in a hour.
Temperature of cells:
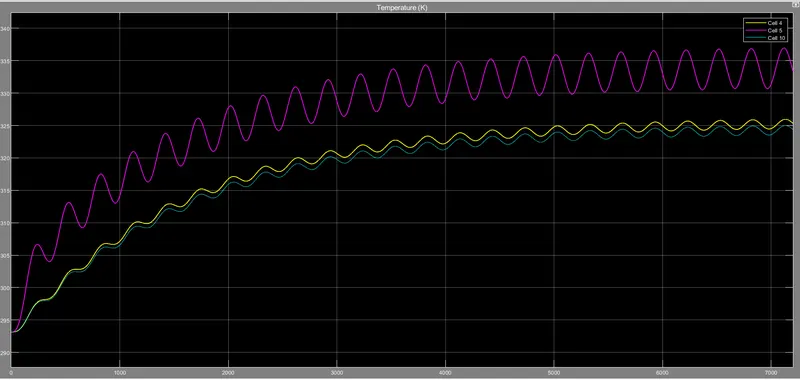
Frist group: Here four cells are connected, Intial Temperature of cell is 293.15 K . At the end of drive cycle the Temperature settles at 320 K.
Second Group: Here One cell is connected. Intial Temperature of cell is 293.15 K . At the end of drive cycle the Temperature settles at 335 K.
Cell is operating in fault conduction. Rating of cell is less. Resistance of cell is more. Due to this reasons cell temperature is raising very fast compare of other Groups.
Third Group: Here Five cells is connected. Intial Temperature of cell is 293.15 K . At the end of drive cycle the Temperature settles at 332 K and this less than frist group.
This is because convection Area of heat transfer is more for third group.
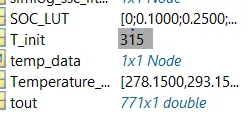
Case 2: Intial Temperature of Cells is 315 K
Intial temperature of battery is changed to 315K in workspace as shown in below figure.
Charge and Discharge profile of a cell
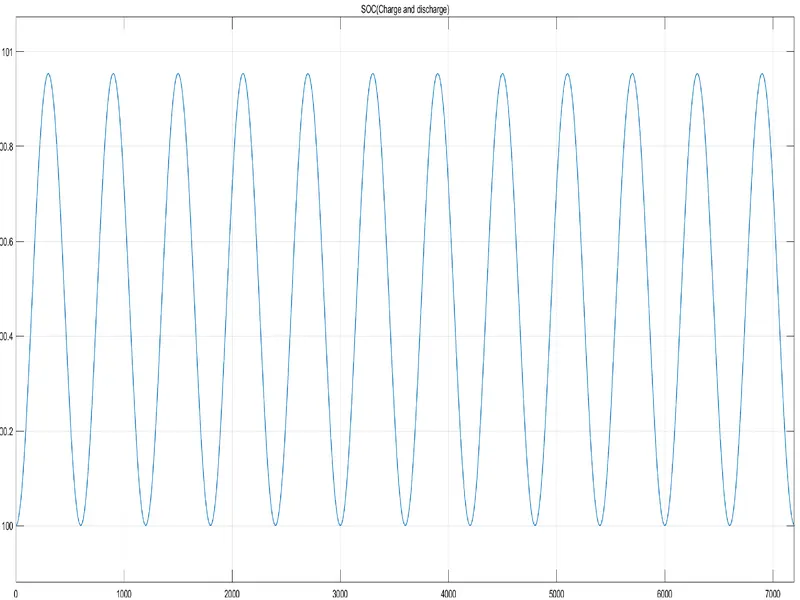
Time period of Each cycle is 720 secs.
Total 6 cycles are covered in a hour.
Temperature of cells:
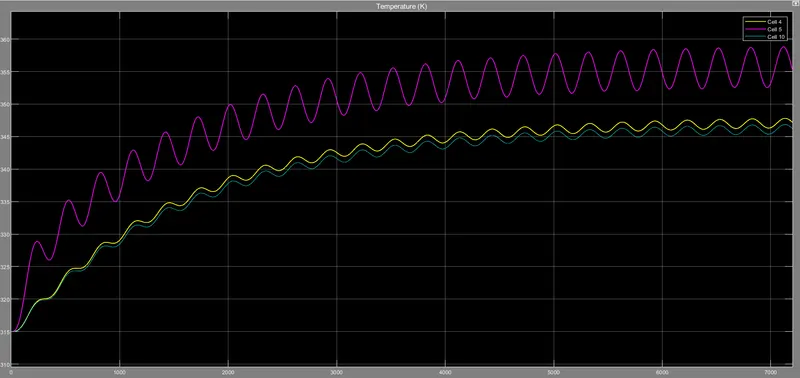
First group: Here four cells are connected, Intial Temperature of cell is 315 K . At the end of drive cycle the Temperature settles at 345 K.
Second Group: Here One cell is connected. Intial Temperature of cell is 293.15 K . At the end of drive cycle the Temperature settles at 355 K.
Cell is operating in fault conduction. Rating of cell is less. Resistance of cell is more. Due to this reasons cell temperature is raising very fast compare of other Groups.
Third Group: Here Five cells is connected. Intial Temperature of cell is 315 K . At the end of drive cycle the Temperature settles at 350 K and this less than frist group.
This is because convection Area of heat transfer is more for third group.
Conculsions:
Matlab Model of 10 series cells of lithium ion battery is simulated. Thermal effects of cell is analysed at various Temperatures.
Faulty cell will go temperature change rapadily compare to other cells.
If temperature of cell goes beyond certain limit, then cell will damage permanently. This will effect other cell groups also.