Project 2 Thermal modeling of battery pack
battery operating temperature for lithium ion batteries should be kept under check to prevent accidents. therefore modelling the temperature rise in situations has become necessary. this project helps us in just that.
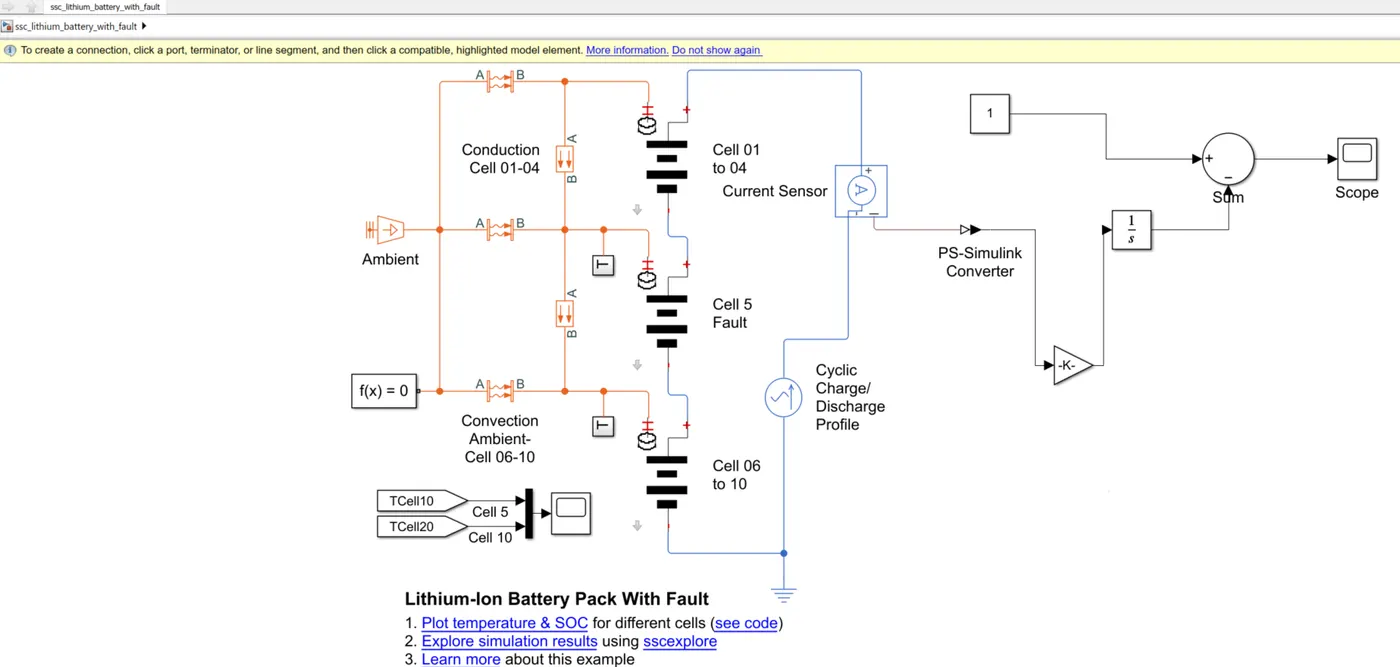
This example shows how to simulate a battery pack consisting of multiple series-connected cells in an efficient manner. It also shows how a fault can be introduced into one of the cells to see the impact on battery performance and cell temperatures. here, cells connected in series and one of the cell is faulty.
For efficiency, identical series-connected cells are not just simply modeled by connecting cell models in series. Instead a single cell is used, and the terminal voltage scaled up by the number of cells. The fault is represented by changing the parameters for the Cell 5 Fault subsystem, reducing both capacity and open-circuit voltage, and increasing the resistance values.
circuit construction appliances used:
cells - table based, ambient temperature block, solver configuration, cyclic charge/discharge profile, current sensor, gain, integrator, sum block, scope, subsystem temperature measurement, convective and conductive heat transfer
circuit construction:
1. 3 cells-table based, are connected in series.
2. circuit is completed by adding a current measuring device to charge/discharge cyclic cycles.
3. the current measuring device is added to gain to the scope.
4. convection and conduction blocks are joined to the 3 cells.
5. ambient temperature is modified each time to get faulty cell behaviour pattern graphs.
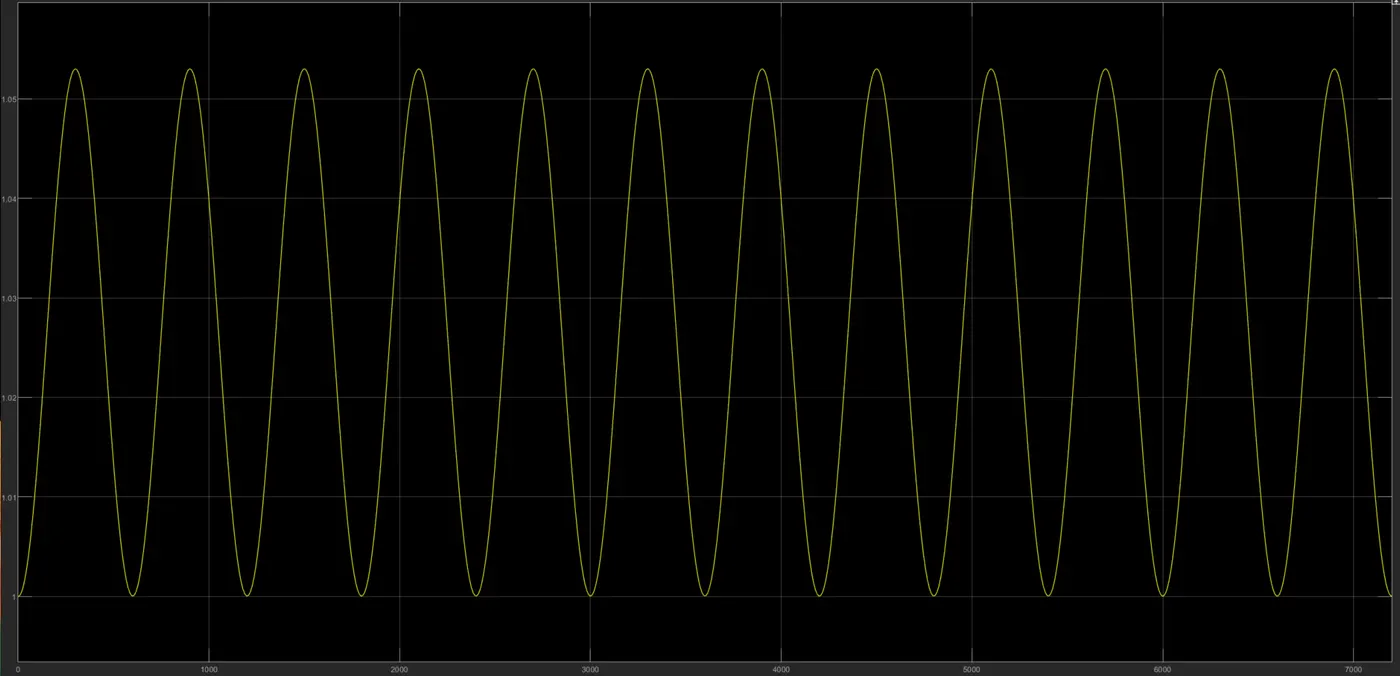
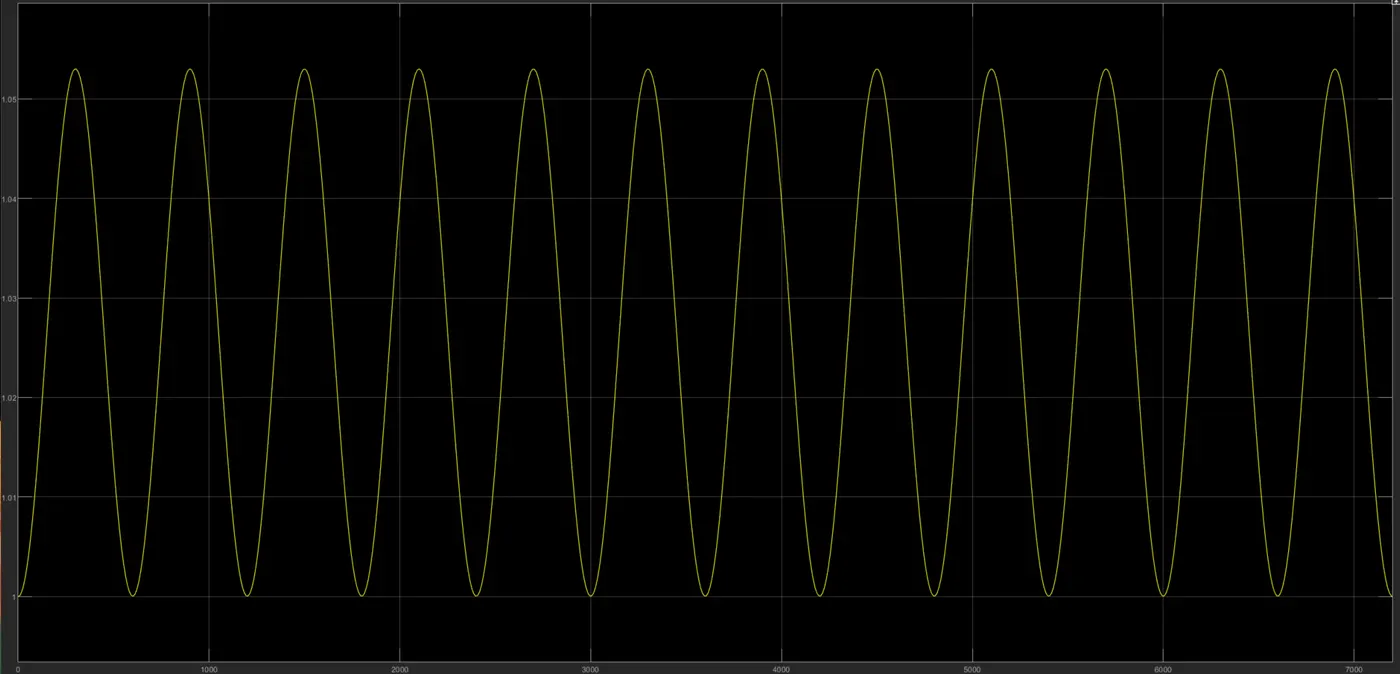
for AC current source, peak amplitude is kept 50 amps and frequency as 1/600 Hz.
image of circuit:
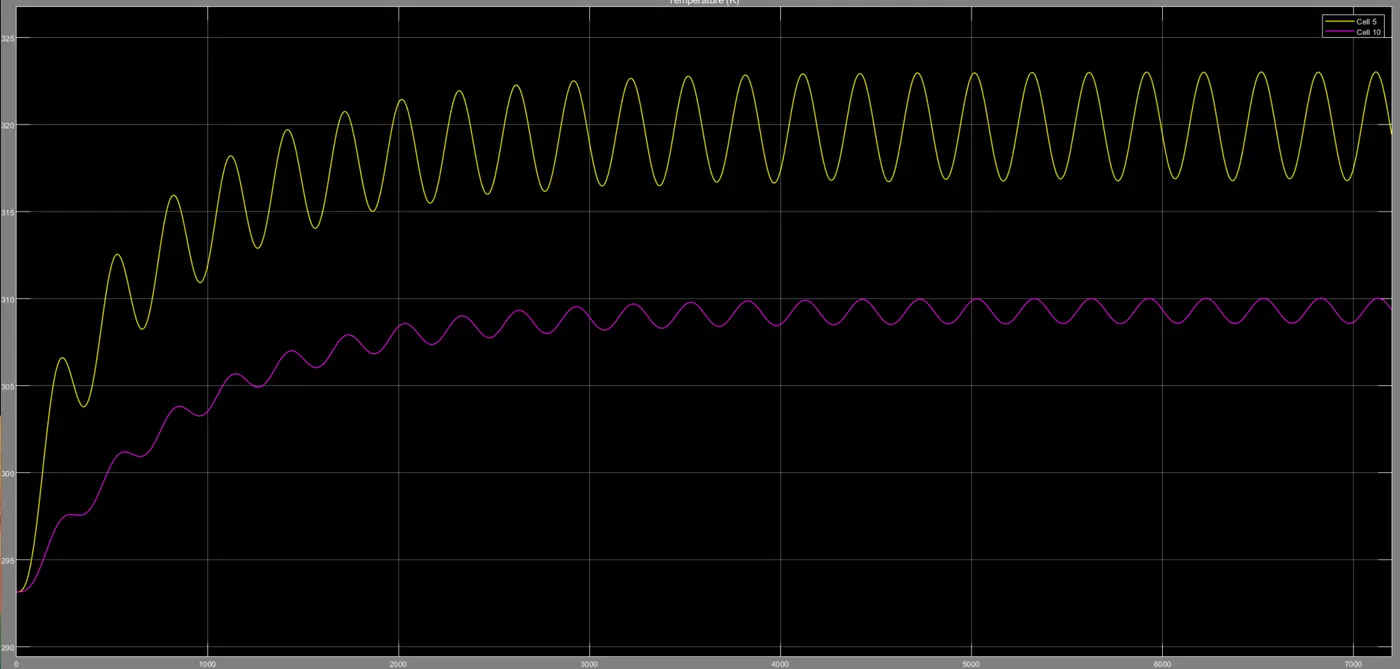
analysis for 300K:
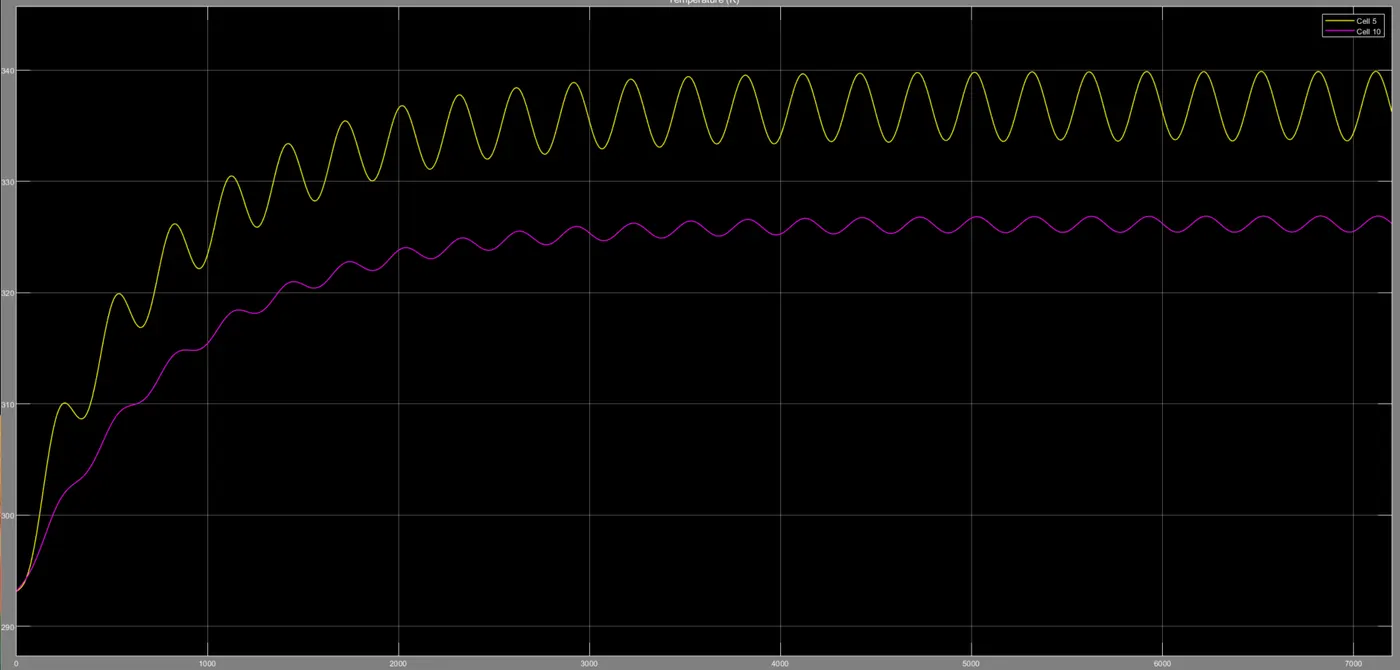
for 310 K analysis:
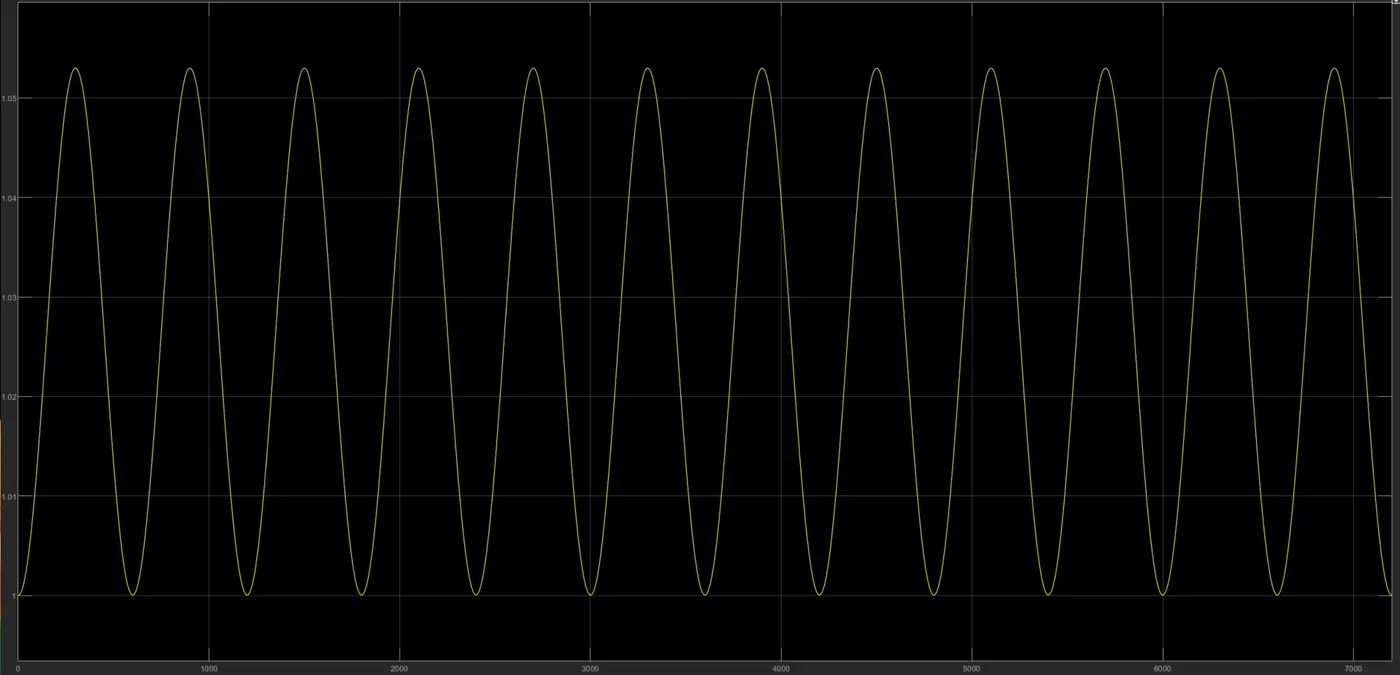
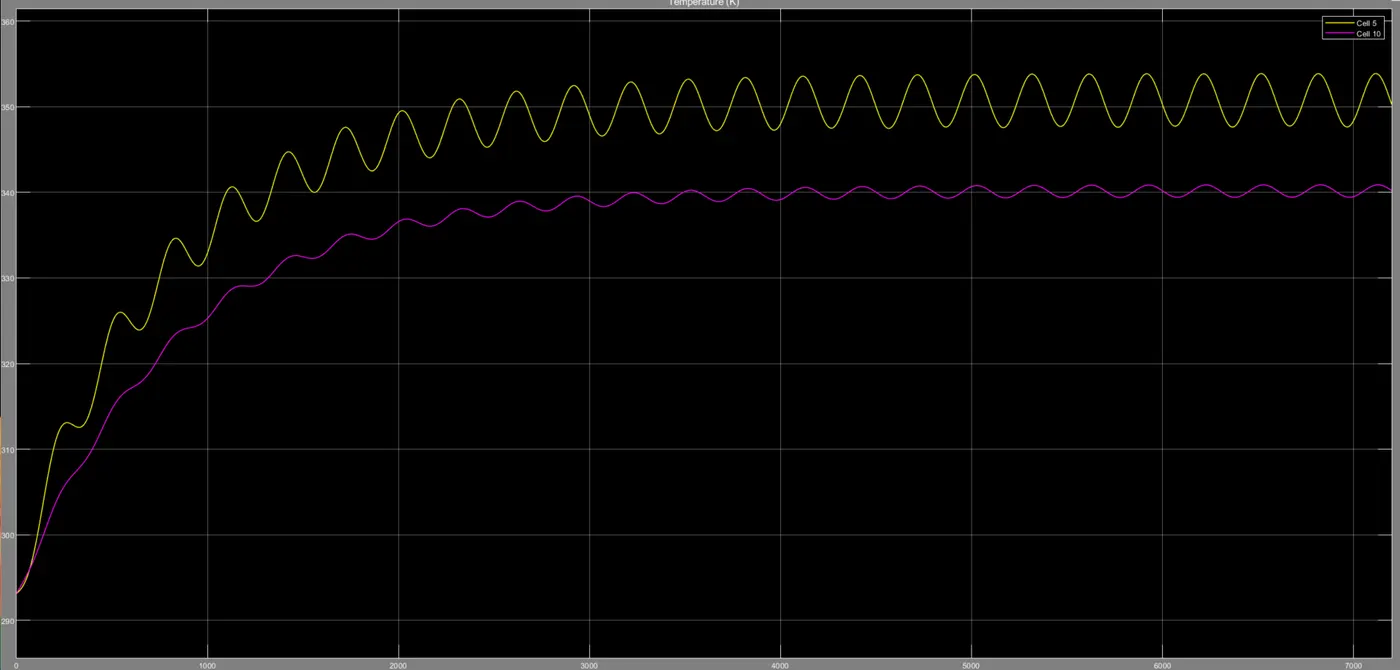
for 324 K analysis:
conclusion and analysis:
For a 10 cell series lithium ion battery model we simulate the thermal effects and compared life cycle performance at various temperatures, charge & discharge rates using MATLAB.
possibility of cell damage and life cycle reduction to cell 5. Cyclic Charge/ Discharge Profile given to circuit to simulate thermal effects. cells 1 to 4 and 6 to 10 behave as normal cells.
for every graph we can see that the faulty cell temperature is more than the counterparts. it ultimately damages the cell and reduces the cell performance.
the final temperatures of the faulty cell can be looked up from graphs - 350K when ambient is 324K, 340K when 310K, 320K when ambient is 300K, this is how the behaviour is.