Project 2 Thermal modeling of battery pack
For a 10 cell series lithium ion battery model
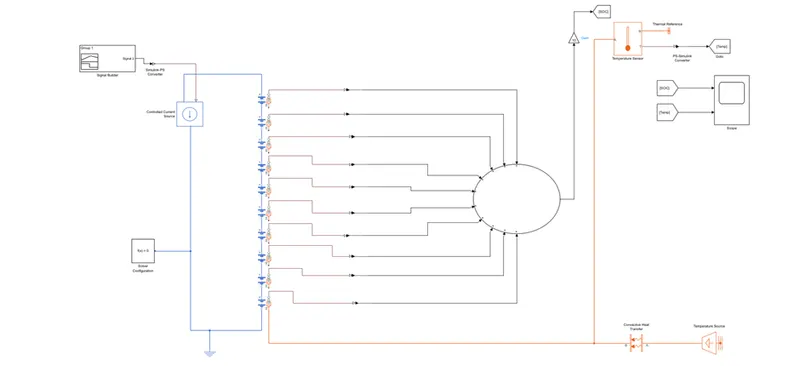
Blocks used for above model as follow:
- Battery (Table-based)
- This block models a battery based on tabulated characteristics as functions of state-of-charge, SOC and optional temperature (T).
- Controlled Current source:
- The block represents an ideal current source that is powerful enough to maintain the specified current through it regardless of the voltage across it. The output current is I = Is, where Is is the numerical value presented at the physical signal port.
- Signal builder:
- The Signal Builder block allows you to create interchangeable groups of piecewise linear signal sources and use them in a model.
- You can quickly switch the signal groups into and out of a model to facilitate testing.
- In the Signal Builder window, create signals and define the output waveforms.
- We get Time and Current value from USSD data source. (Week 4 challenge).
- Resistor:
- The voltage-current (V-I) relationship for a linear resistor is V=I*R, where R is the constant resistance in ohms.
- The sign of the current is positive when flowing through the device from the positive to the negative terminal. This convention ensures that the power absorbed by a resistor is always positive.
- Temperature source:
- This block represents an ideal energy source in a thermal network that can maintain a constant absolute temperature at the port regardless of the heat flow rate.
- Convective heat transfer:
- This block models heat transfer in a thermal network by convection due to fluid motion. The rate of heat transfer is proportional to the temperature difference, heat transfer coefficient, and surface area in contact with the fluid. The heat transfer coefficient can be either constant or variable. When the heat transfer coefficient is variable, specify it using the physical input signal at port K. If the heat transfer coefficient is variable, it remains at the Minimum heat transfer coefficient if the physical signal falls below this value.
- Temperature sensor:
- This block measures temperature in a thermal network. There is no heat flow through the sensor. The physical signal port T reports the temperature difference across the sensor. The measurement is positive when the temperature at port A is greater than the temperature at port B.
- PS- Simulink converter:
- Converts the input Physical Signal to a Simulink output signal.
- GOTO:
- Send signals to From blocks that have the specified tag. If tag visibility is 'scoped', then a Goto Tag Visibility block must be used to define the visibility of the tag. The block icon displays the selected tag name (local tags are enclosed in brackets, [], and scoped tag names are enclosed in braces, {})
- From:
- Receive signals from the Goto block with the specified tag. If the tag is defined as 'scoped' in the Goto block, then a Goto Tag Visibility block must be used to define the visibility of the tag. After 'Update Diagram', the block icon displays the selected tag name (local tags are enclosed in brackets, [], and scoped tag names are enclosed in braces, {}).
- Solver configuration:
- Defines solver settings to use for simulation.
- Electrical reference:
- Electrical reference port. A model must contain at least one electrical reference port (electrical ground).
13 Sum:
- When there is only one input port, add or subtract elements over all dimensions or one specified dimension.
Graph:
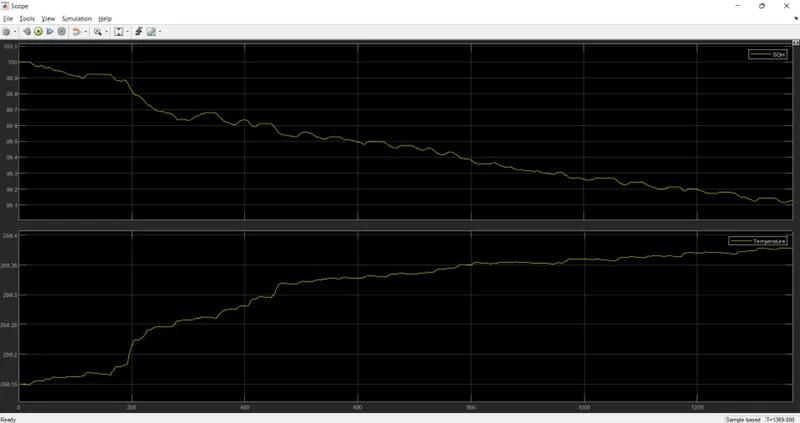
From above graph, we observed that
- For time duration 1369 seconds and at various current range, there was slightly change in temperature and SOC values.
- So, as rate of change current values, temperature of battery increases and SOC of battery decreases.
Case 2: Here we consider contact area is 1 m^2 and Temperature is 350 K. We gets below SOC and temperature graph.
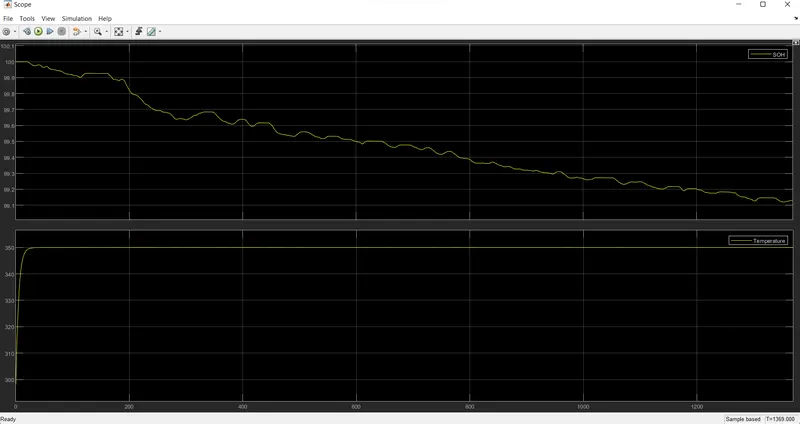
From above graph, we observed that if contact area of convective heat increases, temperature of battery suddenly increases upto maximum limit and remain constant throuth out cycle.
Case 3: Here we consider contact area is 0.01 m^2 and Temperature is 298 K. We gets below SOC and temperature graph.
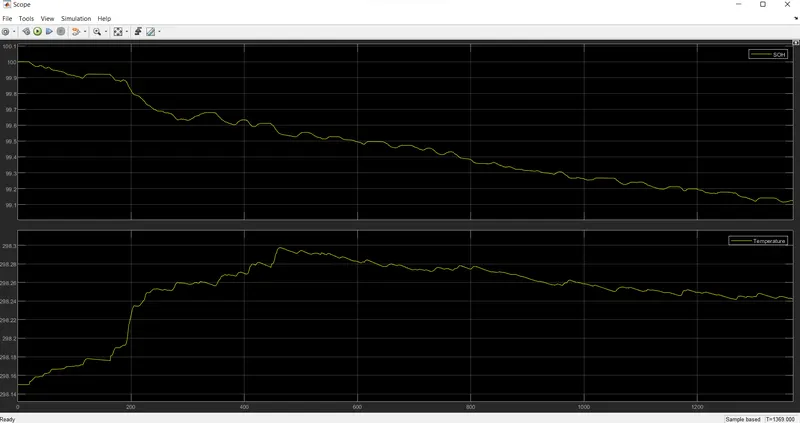
From above graph, contact area of convective heat as 0.01 m^2, we observed that temperature slightly increases and after some time decrease. SOC of battery decreases.
Battery Life cycle performance by considering aging factor:
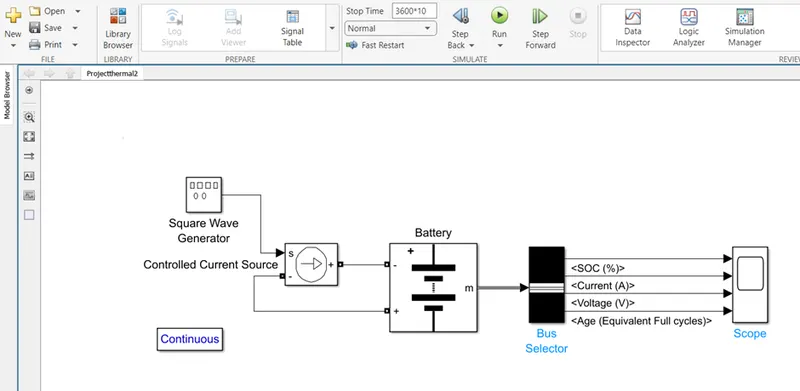
Blocks used for above model as follow:
- Battery:
- Implements a generic battery model for most popular battery types. Temperature and aging (due to cycling) effects can be specified for Lithium-Ion battery type.
- Controlled Current source:
- The block represents an ideal current source that is powerful enough to maintain the specified current through it regardless of the voltage across it. The output current is I = Is, where Is is the numerical value presented at the physical signal port.
- Square wave Generator:
- For getting output at wave form format.
- Bus Selector:
- This block accepts a bus as input which can be created from a Bus Creator, Bus Selector or a block that defines its output using a bus object.
- The left list box shows the elements in the input bus. Use the Select button to select the output elements. The right list box shows the selections. Check 'Output as virtual bus to output a single bus’.
- Powergui:
Set simulation type, simulation parameters, and preferences.
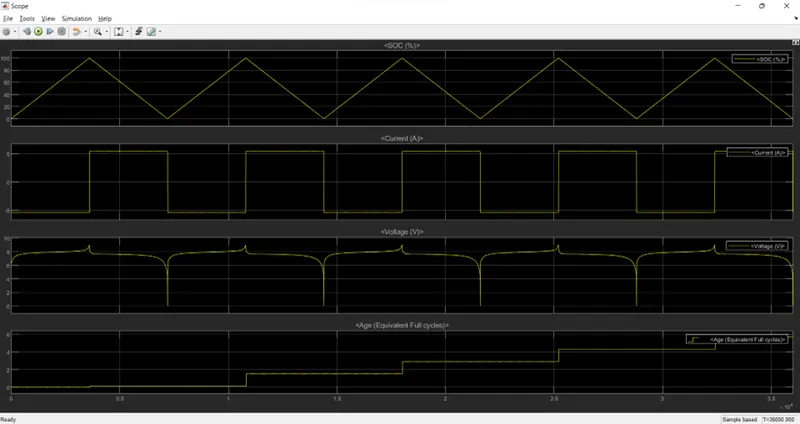
From above graph, we used below parameter values.
For block Square wave generator, Amplitude as 5.4, Frequency as 1/(3600*2) Hertz for 1 complete charging and discharging cycle of battery.
For Battery, Aging model sampling time as 20 second and initially battery SOC as 0% for getting complete aging factor from complete discharging to charging cycle.
From graph, we ran simulation for 10 hours and we observed that
- From battery one charging and discharging cycle, we get aging factor of battery increase by 1 value and going on accordingly battery charging and discharging cycle.
- During charging voltage parameter increases up to 9 V and decrease as during battery discharging cycle.
- We get square wave form current parameter. Negative values of current indicate Discharging cycle and positive value of current for charging cycle.
As we change values of current, battery capacity, ageing values, battery SOC etc we will get another type of graph of aging of battery which indicate life cycle of battery.
Battery life is nothing one complete cycle of charging and discharging process of battery. And it heavily effected by charging current, voltage time duration, temperature of battery etc factors.
Enclosed:
Project 1 model- For a 10 cell series lithium ion battery model,
Project 2 model- compare life cycle performance at various temperatures, charge & discharge rates using MATLAB.