Project 2 Thermal modeling of battery pack
Aim: Thermal modeling of battery pack consists of 10 cell are connected in series, Simulate the thermal effects and compare life cycle performance at various temperatures, charge and discharge rates using MATLAB.
Taken Lithium ion Cell - NCR18650BD
Sprcification:
| Cell Model | Panasonic NCR18650BD |
| Nominal Voltage | 3.6V |
| Rated Capacity at `25^0C` | 3180mAh |
| Energy density | 11.4Wh |
| Standard Charge | 0.3C-4.2V |
| Discharge end voltage | 2.5V |
| Diameter | 18.5mm |
| Height | 65.3mm |
| Weight | 49.5g |
| Operating Temperature |
Charge 10 to `45^0C` Disharge -20 to `60^0C` |
Required Results.
| Sl.no. | Charging rate | Discharging rate | Battery Temperature |
| 1 | 0.3C | 1C | `25^0C` |
| 2 | 0.3C | 1C | `10^0C` |
| 3 | 0.5C | 2C | `25^0C` |
| 4 | 0.5C | 2C | `10^0C` |
STEPS TO BUILD THE THERMAL MODEL OF A BATTERY PACK
SELECTING THE THERMAL DEPENDENT CELL
- Select the Battery table based block in the Simscape Electrical Library
- Choice the block type of Instruemented | Show Thermal ports.
- Select the required cell from the list " Select a predefined parameterization" option.
- Panasonic NCR18650BD selected from the list.
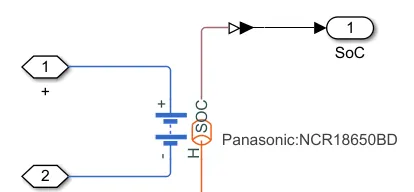
Fig1: Battery with Thermal ports.
CONNECTING THE THERMAL MANAGEMENT CIRCUIT TO COOL A CELL.
- Connect the cell with Temeprature Source through the Convective Heat Transfer.
- Connective Heat Transfer with area of contact = `pi*dia*ht` = `pi*18.5*65.5` =`38.06825cm^2`~`38cm^2`
- For Sensing the Temperature of the cell we need to use the Temperature Sensor block.
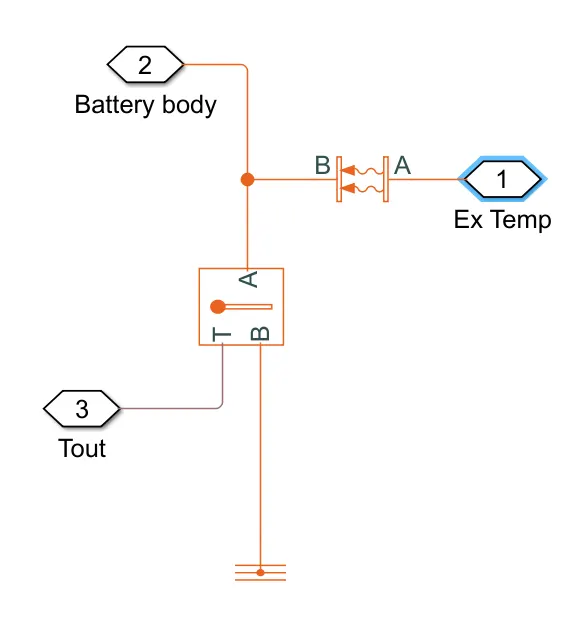
Fig2: Thermal Circuit required for Cooling Cell.
These above steps are common for all those 10 cells. So, lets create all the above as an Subsystem and make it as Reference Subsystem.
- After connect all the 10 cell subsystem in series such that they meet the requirement.
- Creating two subsystem consists of 5 of each, where calculating the SoC and Temperature of the module.
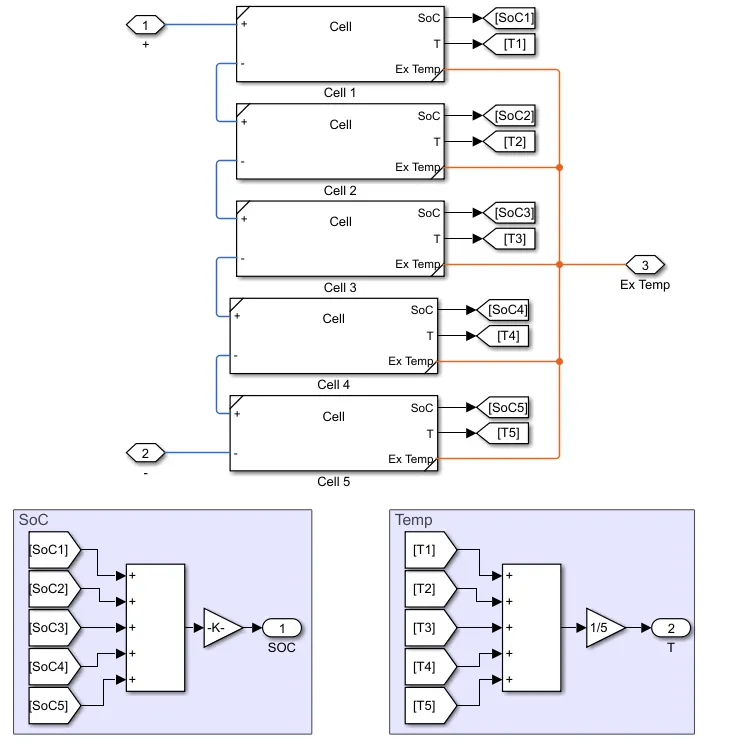
Fig3: Module Consisting of 5 cells connected in series.
- Connect those two modules in series to all the 10 cells in series.
- Now Cumulate and find the Battery Pack SoC and Internal Temperature.
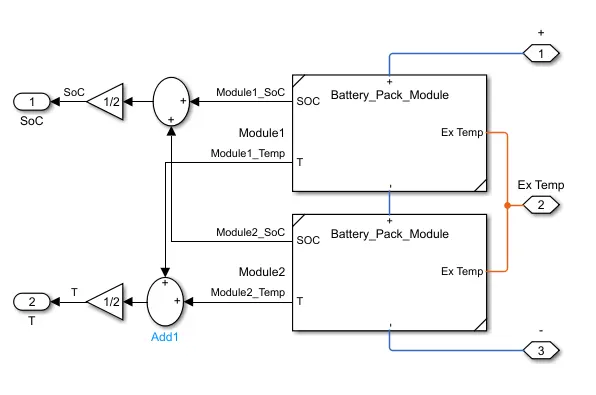
Fig4: Battery pack with two module.
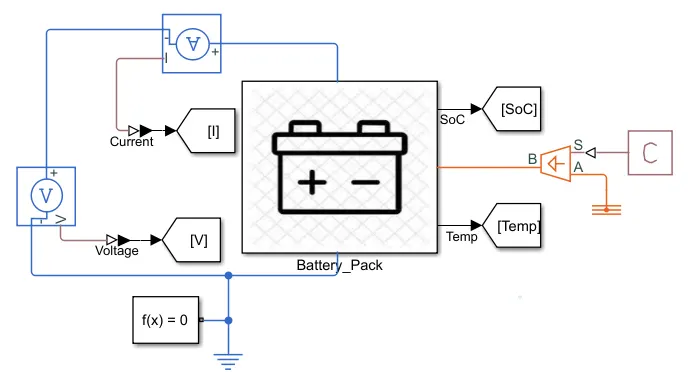
Fig5: Required connection for better analysis.
FOR BETTER ANALYSIS
- For better analysis considering the operation of charging and discharging in one cycle.
- To make the perfect cycle using flow chart as controlled feedback. This will help in giving the result for better analysis.
- The below state flow will monitor battery pack SoC
- When initially SoC of the cell set to 5%. So it will go to Charge state and after it reaches to 100% will change to discharging it will loop in the same state untill it reaches 0% or near .
- Changing the Ex Temp value such that heating and cooling takes in one cycle (one charging and one discharging). That helps in better visual analysis on thermal effects
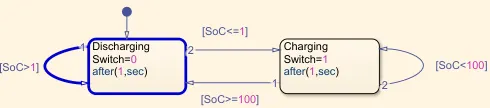
Fig6: State flow that controls the circuit for better analysis.
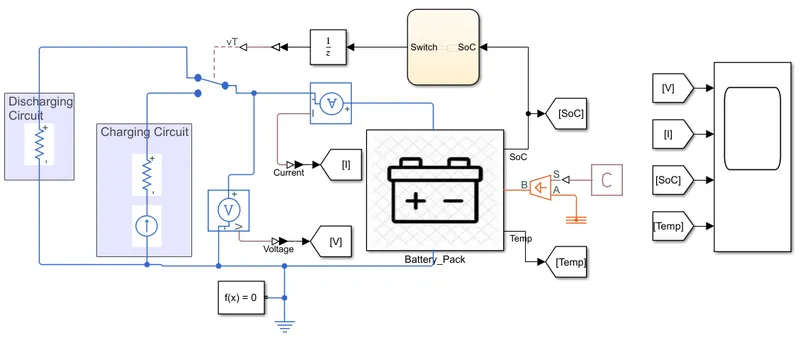
Fig7: Final Circuit for Thermal modelling of the battery pack.
CALCULATION FOR THE ANALYSIS.
1C rate means state which a complete charge or discharge in one hour or Rate of charge or discharge is equal to the capacity of the battery pack or a cell.
`I_(1C)`=3.2A.
`I_(2C)`=2*3.2=6.40A
`I_(0.5C)`=0.5*3.2=1.6A
`I_(0.3C)`=0.3*3.2=0.96A
`R_(Discharge)= `V_(nominal)/I_(Discharge)`
SIMULATING THE THERMAL EFFECTS ON THE BATTERY PACK.
| Conditions | Values Calculated | Scope Result |
|
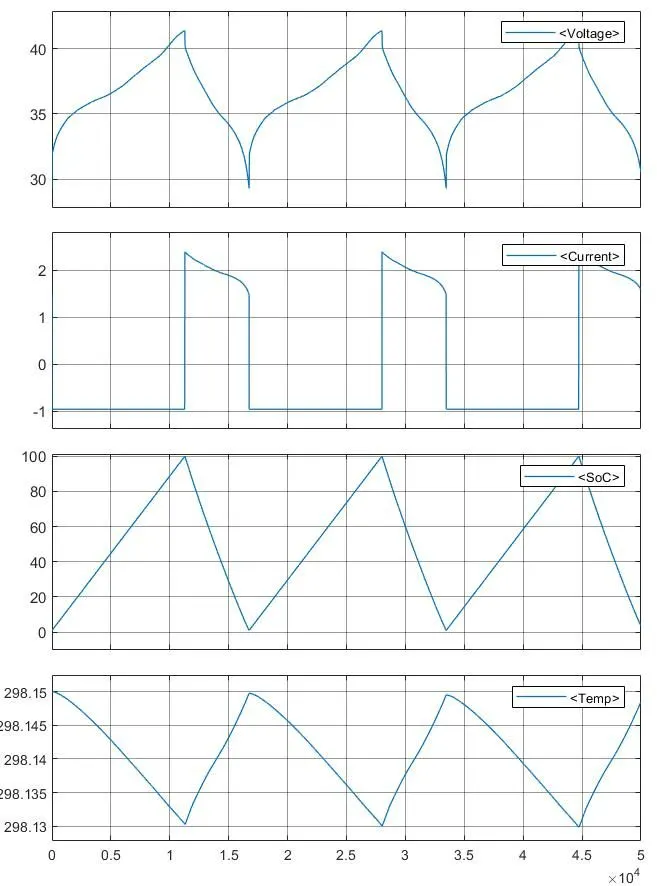
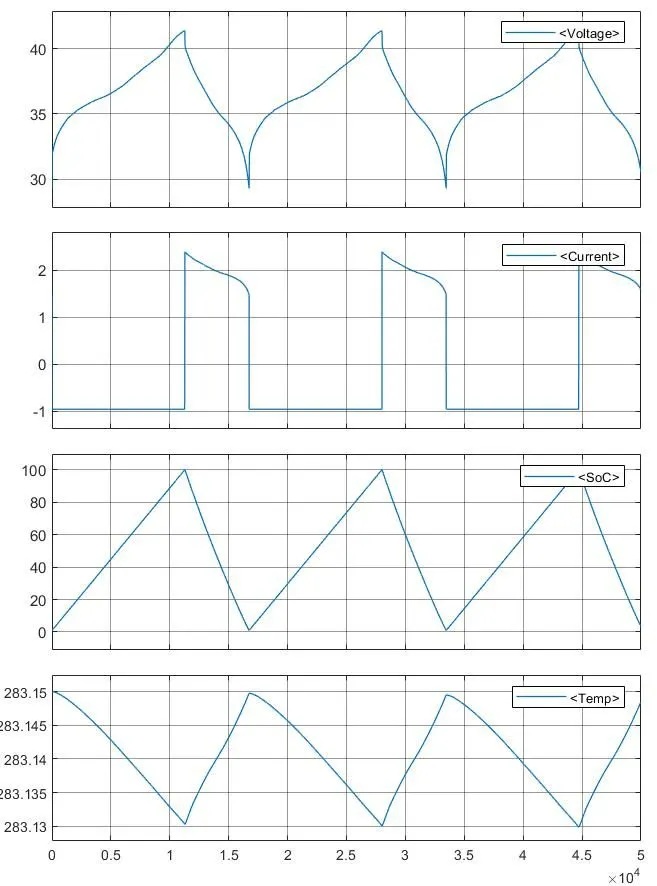
`I_(C)`=0.96A `I_(D)`=3A `R_(D)=12Omega` `Temp_(Ex)`=296.84K |
 |
|
`I_(C)`=0.96A `I_(D)`=3A `R_(D)=12Omega` `Temp_(Ex)`=281.8K |
 |
|
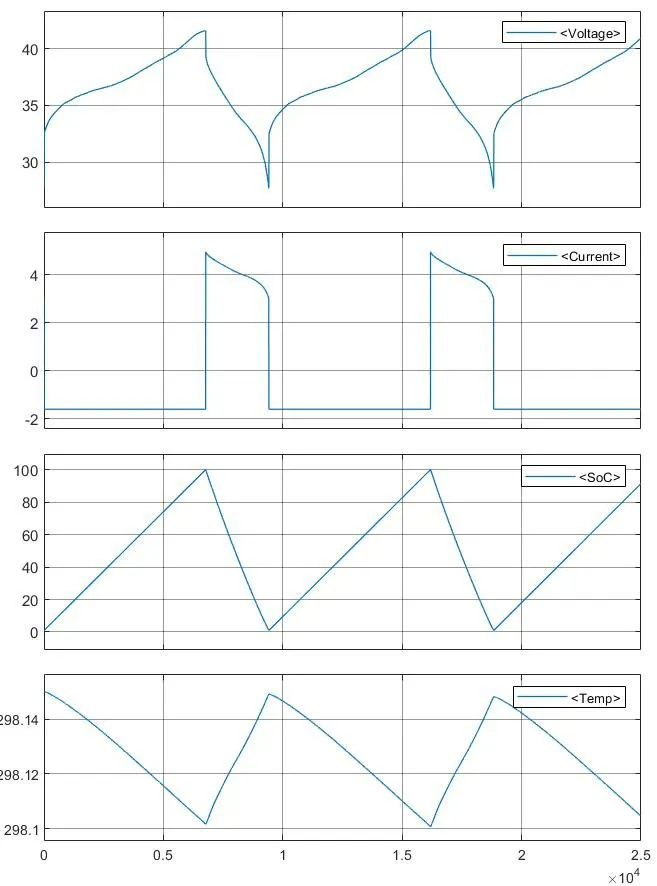
`I_(C)`=1.6A `I_(D)`=6A `R_(D)=6Omega` `Temp_(Ex)`=293.5K |
 |
|
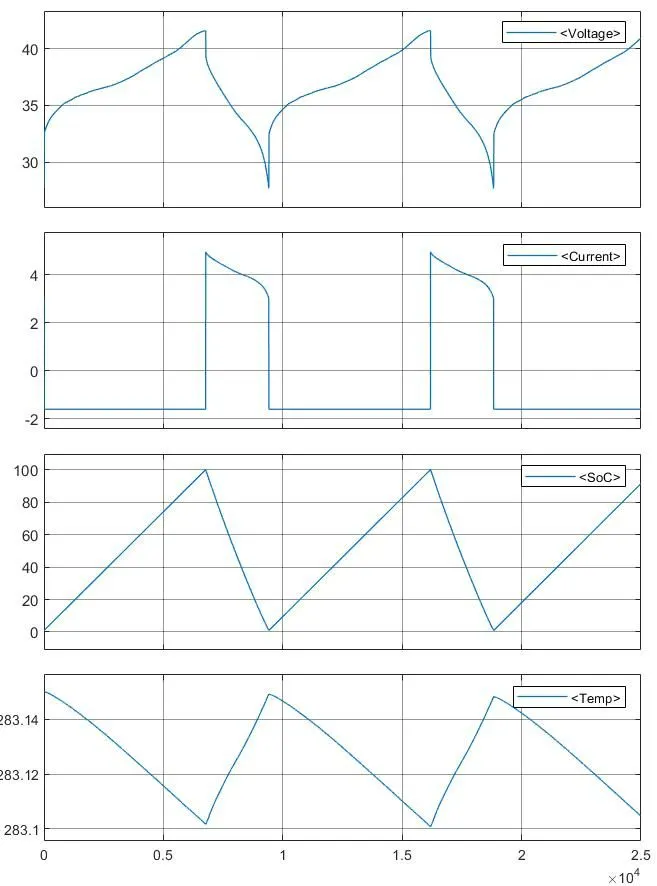
`I_(C)`=1.6A `I_(D)`=6A `R_(D)`=6Omega` `Temp_(Ex)`=278.5K |
|
ANALYSIS ON THERMAL EFFECTS AND EFFECTS ON LIFE CYCLE OF THE BATTERY.
From the above simulation result we can analyse the thermal effects on life cycle of the battery pack.
- In first simultion low charging and low discharge rate at `25^0C`, we can clearly see that the change in temperature of 0.02K over a cycle.
- In second condition same rate consider at `10^0C`, we can see that change in temperature of 0.02K over a cycle.
- In third condition, higher charge and higher discharge rate at `25^0C`, we can clearly see that the change in temperature of 0.05K over a cycle.
- In fourth condition the same rate considered as in third condition at `25^0C`, we can see that the change in temperature of 0.05K over a cycle.
- By the above four different simulation result, Even the intial internal temperature does not effect the raise in temperature. It is majorly depends on cooling system. Better the cooling system better life cycle.
- Higher rate of conductivity higher effects on the performance. Because high value of current flows through the battery pack which intern raises the internal temperature. So, considering the lower rate of charge or discharge will helps to improve the life cycle of the battery pack.
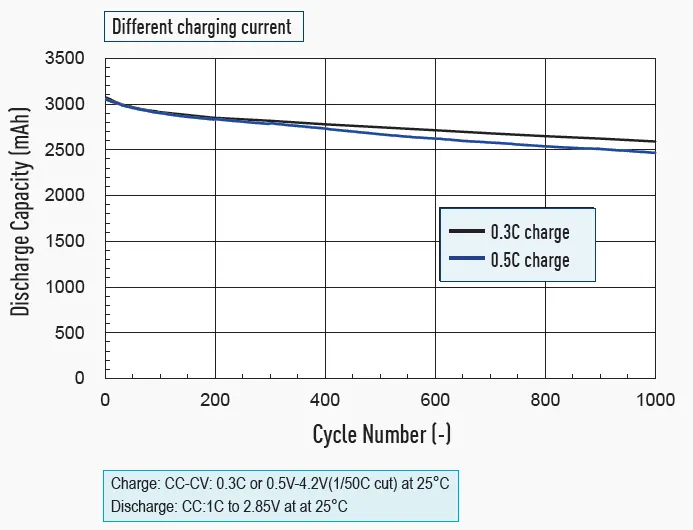
- The above characteristics shows the effects of different charging current on life cycle of the given cell.
RESULT:
Hence for better life cycle,
- Low Charging current.
- Better thermal conduting body (better Thermal coefficient) and larger area of contact.
- Better cooling system for better thermal management will also increases the better performance.