Project 2 Thermal modeling of battery pack
Our Objective is :- For a 10 cell series lithium ion battery model, simulate the thermal effects and compare life cycle performance at various temperatures, charge & discharge rates using MATLAB
For achieving our objective I have chosen 4 temperature i.e:-
1) 298.15 K
2) 310 K
3) 325 K
And various charge and discharge rate will be in SIGNAL BUILDER which I will show during explanation
First of all lets see pic of model {I have also attached the model in box}
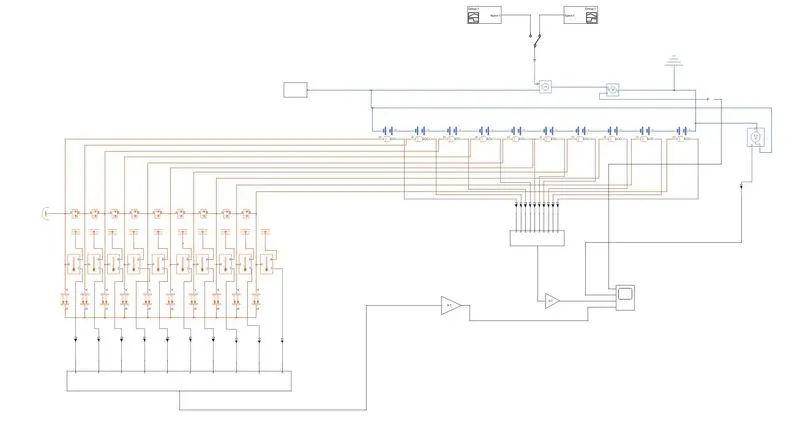
Starting from above the above 2 block are signal builder (left) which is charging signal & right block is discharging after that it goes to manual switch which is useful for instant switching between charging and discharging so after that it goes to controlled current source followed by current sensor, a voltage sensor is also attached to record potential difference while charge and discharge after that we have connected 10 cells in series (as per questions) then I have taken signal from all SOC port and connected to add port then further connected it to scope, also I have connected conductive & convective heat transfer block & temperature sensor which also goes to add block and finally after passing through add port it goes to scope.
Lets analyse First experiment
* CONDITION:- CHARGING
* INITIAL TEMP:- 298.15 K
* INITIAL SOC:- 0
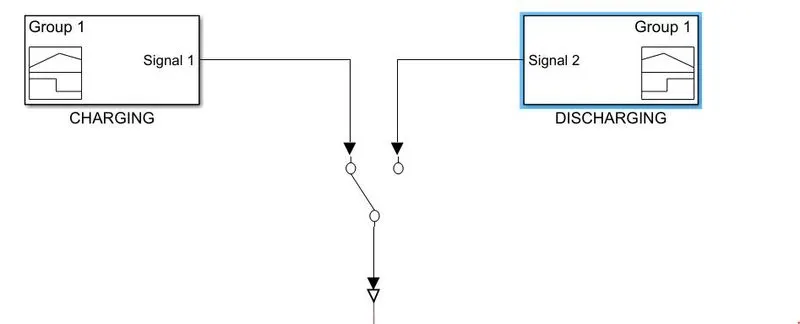
switch is turned to charging block manually.
So basically lets see charging rate or signal builder's signal.
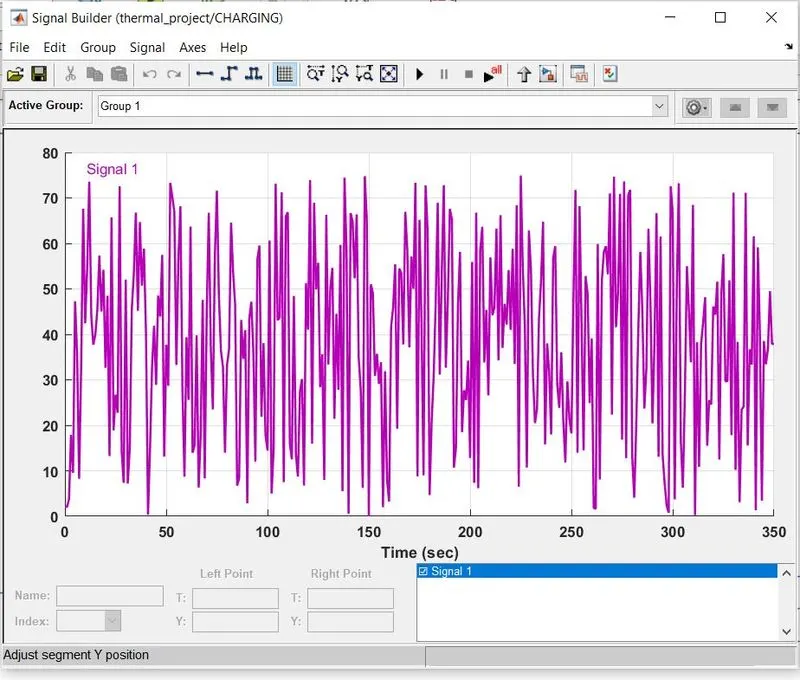
so this is the signal for about 350 sec time duration y axis reperents positive current which means charging is provided to battery , but in scope the current will be shown in negative values (means charging) , & the datas are collected from various batteries testing websites , in which first signal is shown above.
now lets see by simulating the model in charging mode
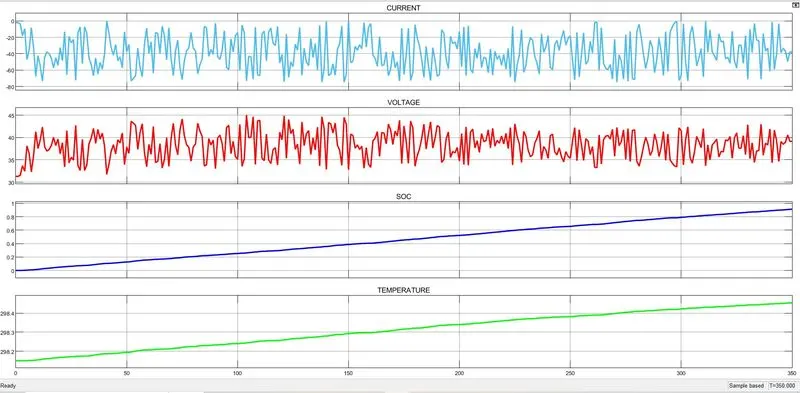
Here we can see that the current is in negative value which means charging & varies according to signal provided after that we can see that voltage also varies according to current but we can feel that it is mirror image of current this is because value of current shown is negative but if it was shown positive the graph would be same as current because by equation V=I . R , after that we can observe that SOC varies from 0 to 90 % in 350 sec which is quite high for charging condition , thats why we can see that there is significant change in temperature of all combined battery in 5 min 50 sec means temp changes from 298.15 to 298.45 this is because there is energy stored in battery & some amount of energy is converted to heat while charging which further conducted to battery body hence there is temp rise.
So here ΔT is "0.3" deg cel
* CONDITION:- DISCHARGING
* INITIAL TEMP:- 298.15 K
* INITIAL SOC:- 1
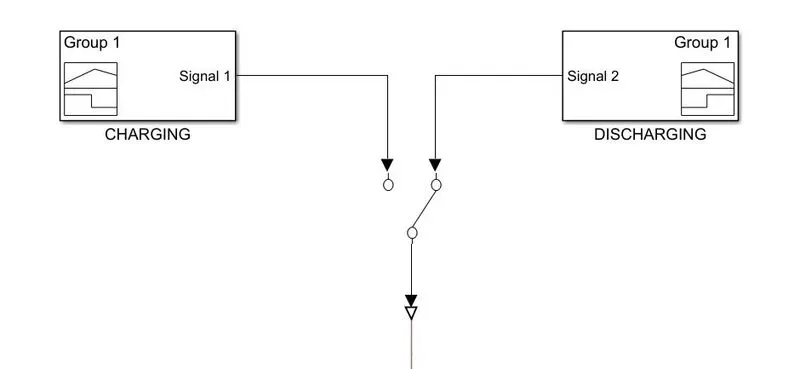
Now the switch is turned to discharge mode manually.
So basically lets see discharging rate or signal builder's signal.
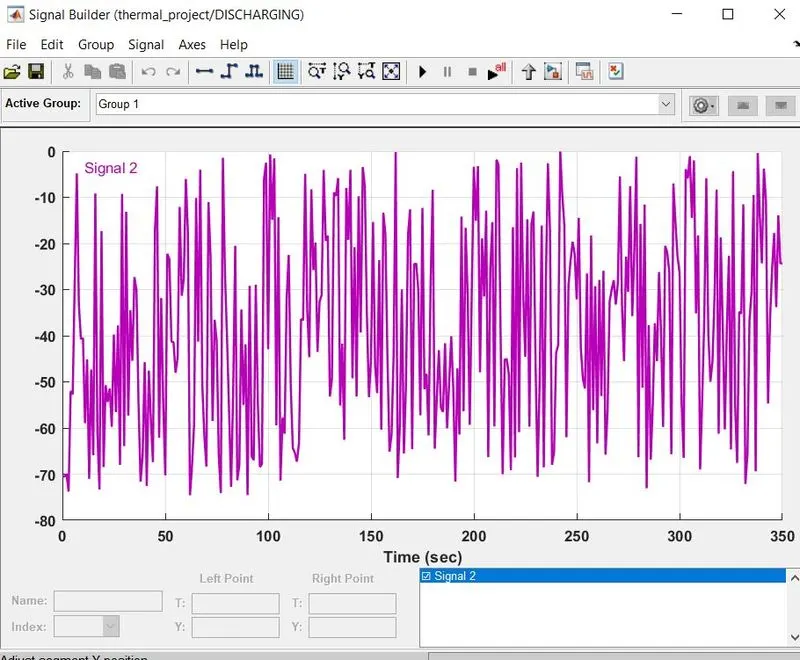
so this is the signal for about 350 sec time duration y axis represents negative current which means discharging is provided to battery , but in scope the current will be shown in positive values (means discharging) , & the datas are collected from various batteries testing websites , in which second signal is shown above.
now lets see by simulating the model in discharging mode
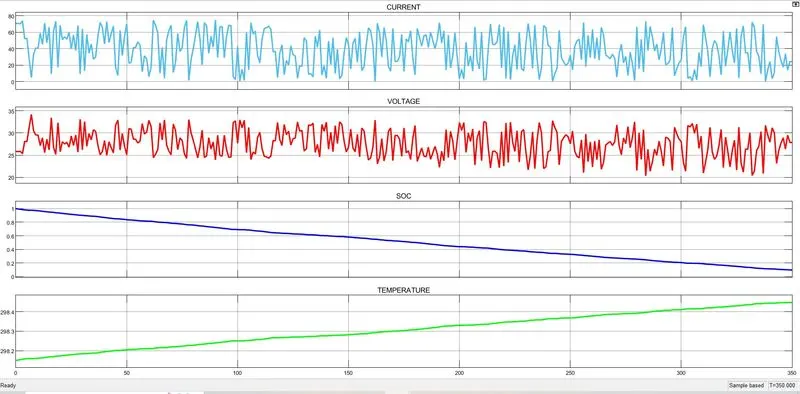
Here we can see that the current is in positive value which means discharging & varies according to signal provided after that we can see that voltage also varies according to current but we can feel that it is mirror image of current this is because the scope current and signal provided by dignal generator is having inverse relation but if it was shown positive the graph would be same as current because by equation V=I . R , after that we can observe that SOC varies from 100 to 10 % in 350 sec which is quite high for discharging condition , thats why we can see that there is significant change in temperature of all combined battery in 5 min 50 sec means temp changes from 298.15 to 298.45 this is because there is energy stored in battery & some amount of energy is converted to heat while discharging which further conducted to battery body hence there is temp rise.
So here ΔT is "0.3" deg cel
Lets analyse Second experiment
* CONDITION:- CHARGING (new signal)
* INITIAL TEMP:- 310 K
* INITIAL SOC:- 0
switch is turned to charging block manually , but first the signal in block were updated to new signal.
So basically lets see charging rate or signal builder's signal.
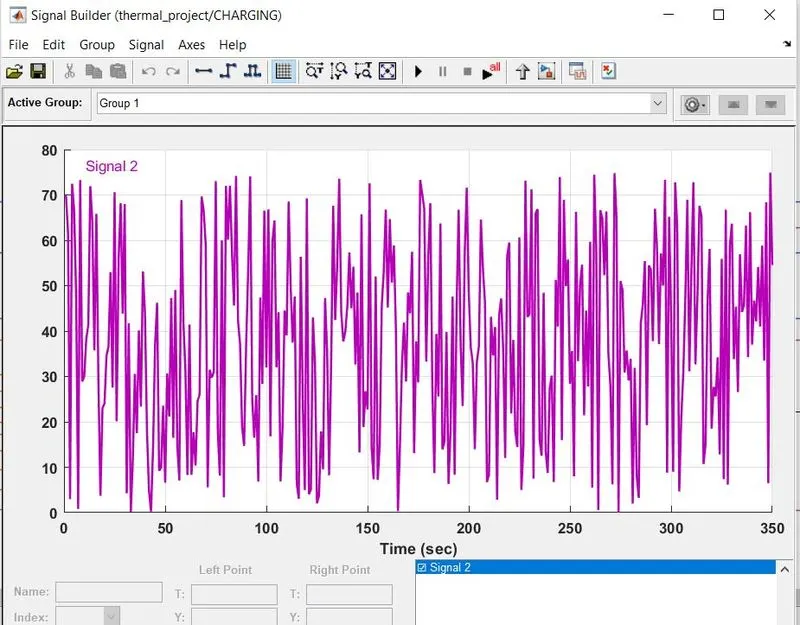
so this is the signal for about 350 sec time duration y axis reperents positive current which means charging is provided to battery , but in scope the current will be shown in negative values (means charging) , & the datas are collected from various batteries testing websites , in which first signal is shown above.
now lets see by simulating the model in charging mode
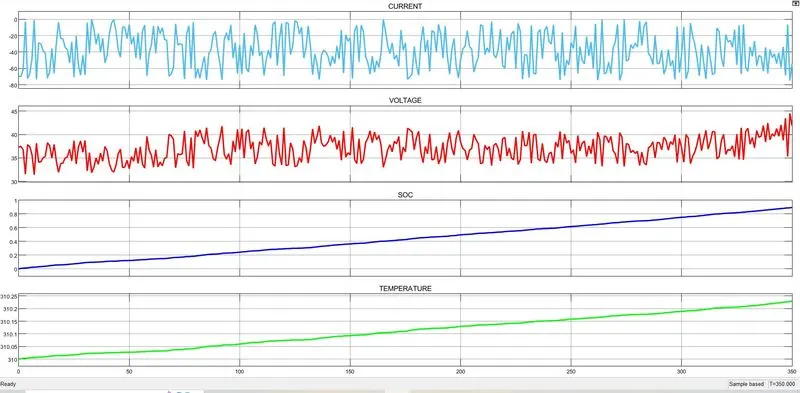
Here we can see that the current is in negative value which means charging & varies according to signal provided after that we can see that voltage also varies according to current but we can feel that it is mirror image of current this is because value of current shown is negative but if it was shown positive the graph would be same as current because by equation V=I . R , after that we can observe that SOC varies from 0 to 90 % in 350 sec which is quite high for charging condition , thats why we can see that there is significant change in temperature of all combined battery in 5 min 50 sec means temp changes from 310 to 310.23 this is because there is energy stored in battery & some amount of energy is converted to heat while charging which further conducted to battery body hence there is temp rise.
So here ΔT is "0.23" deg cel
* CONDITION:- DISCHARGING (new signal)
* INITIAL TEMP:- 310 K
* INITIAL SOC:- 1
switch is turned to discharging block manually , but first the signal in block were updated to new signal.
So basically lets see discharging rate or signal builder's signal
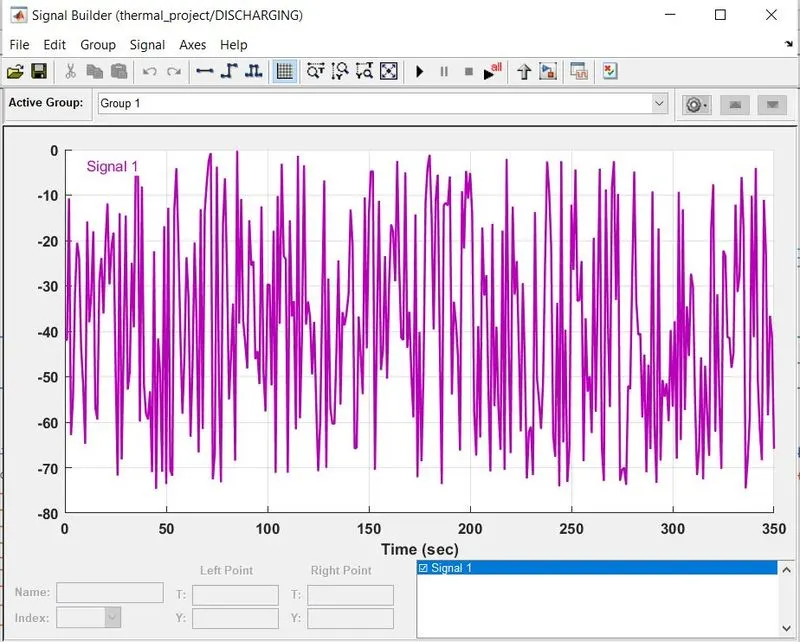
so this is the signal for about 350 sec time duration y axis represents negative current which means discharging is provided to battery , but in scope the current will be shown in positive values (means discharging) , & the datas are collected from various batteries testing websites , in which second signal is shown above.
now lets see by simulating the model in discharging mode
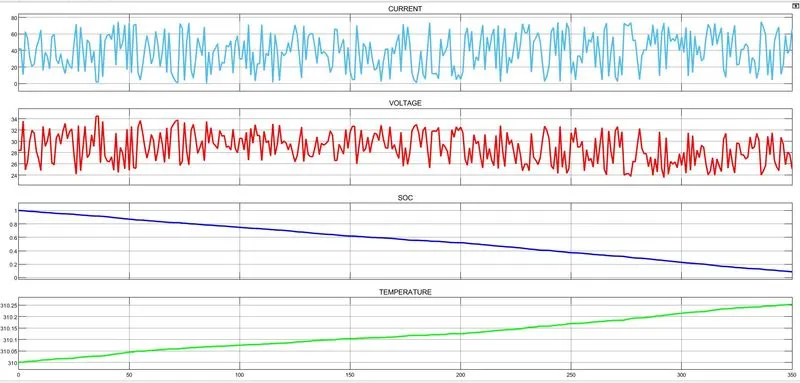
Here we can see that the current is in positive value which means discharging & varies according to signal provided after that we can see that voltage also varies according to current but we can feel that it is mirror image of current this is because the scope current and signal provided by dignal generator is having inverse relation but if it was shown positive the graph would be same as current because by equation V=I . R , after that we can observe that SOC varies from 100 to 10 % in 350 sec which is quite high for discharging condition , thats why we can see that there is significant change in temperature of all combined battery in 5 min 50 sec means temp changes from 310 to 310.25 this is because there is energy stored in battery & some amount of energy is converted to heat while discharging which further conducted to battery body hence there is temp rise.
So here ΔT is "0.25" deg cel
Lets analyse Third experiment
* CONDITION:- CHARGING (new signal other than above all)
* INITIAL TEMP:- 325 K
* INITIAL SOC:- 0
switch is turned to charging block manually , but first the signal in block were updated to new signal.
So basically lets see charging rate or signal builder's signal.
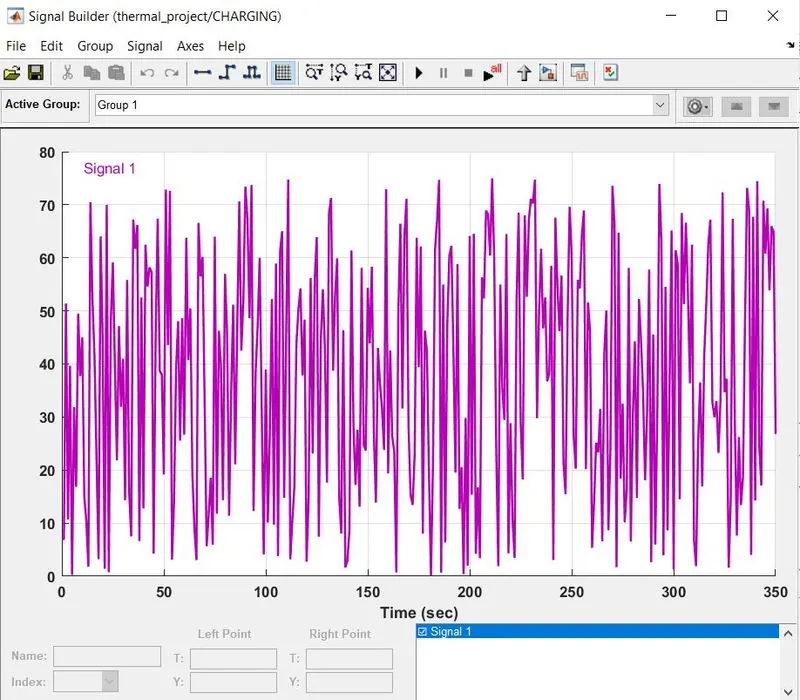
so this is the signal for about 350 sec time duration y axis reperents positive current which means charging is provided to battery , but in scope the current will be shown in negative values (means charging) , & the datas are collected from various batteries testing websites , in which first signal is shown above.
now lets see by simulating the model in charging mode
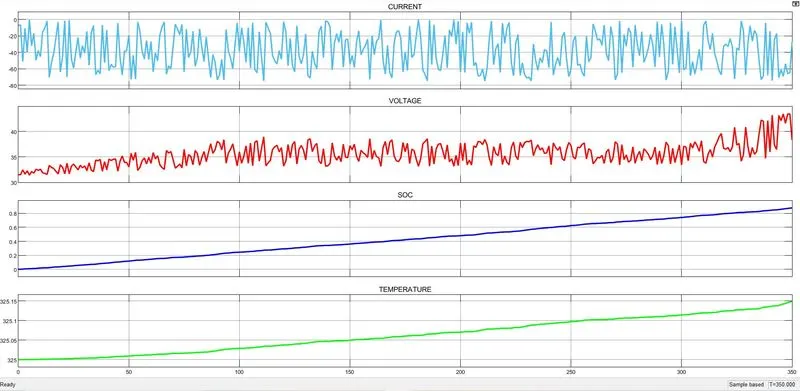
Here we can see that the current is in negative value which means charging & varies according to signal provided after that we can see that voltage also varies according to current but we can feel that it is mirror image of current this is because value of current shown is negative but if it was shown positive the graph would be same as current because by equation V=I . R , after that we can observe that SOC varies from 0 to 90 % in 350 sec which is quite high for charging condition , thats why we can see that there is significant change in temperature of all combined battery in 5 min 50 sec means temp changes from 325 to 325.15 this is because there is energy stored in battery & some amount of energy is converted to heat while charging which further conducted to battery body hence there is temp rise.
So here ΔT is "0.15" deg cel
* CONDITION:- DISCHARGING (new signal other than all above)
* INITIAL TEMP:- 325 K
* INITIAL SOC:- 1
switch is turned to discharging block manually , but first the signal in block were updated to new signal.
So basically lets see discharging rate or signal builder's signal
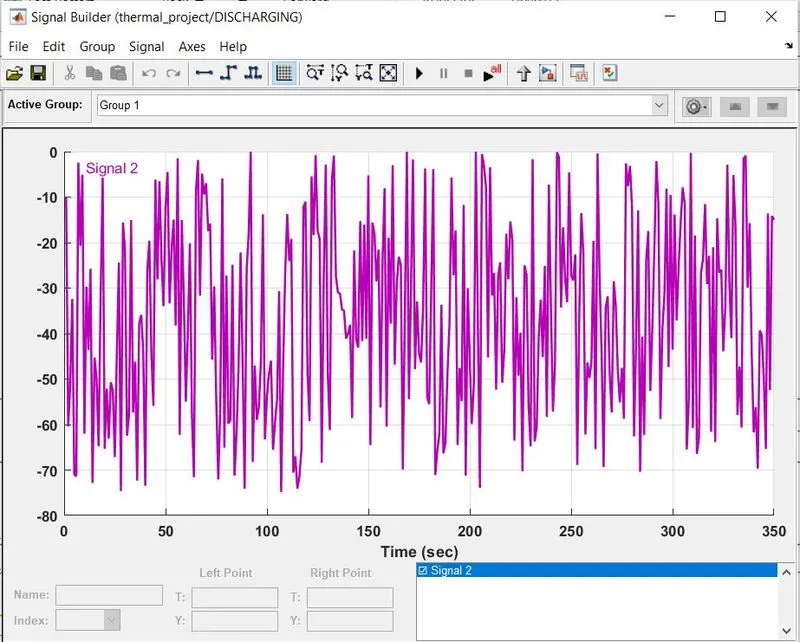
so this is the signal for about 350 sec time duration y axis represents negative current which means discharging is provided to battery , but in scope the current will be shown in positive values (means discharging) , & the datas are collected from various batteries testing websites , in which second signal is shown above.
now lets see by simulating the model in discharging mode
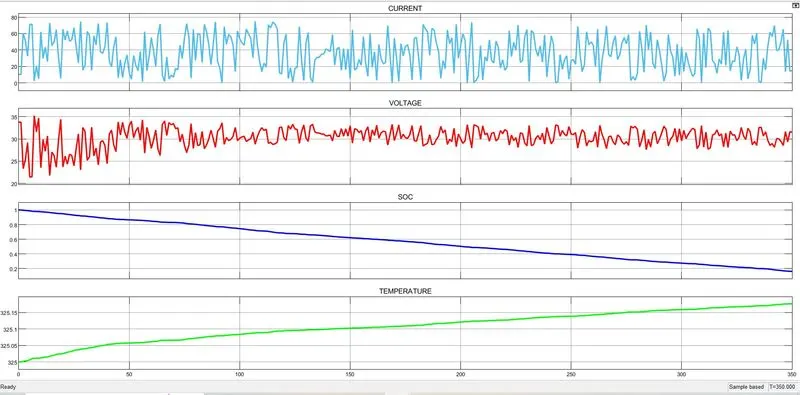
Here we can see that the current is in positive value which means discharging & varies according to signal provided after that we can see that voltage also varies according to current but we can feel that it is mirror image of current this is because the scope current and signal provided by dignal generator is having inverse relation but if it was shown positive the graph would be same as current because by equation V=I . R , after that we can observe that SOC varies from 100 to 10 % in 350 sec which is quite high for discharging condition , thats why we can see that there is significant change in temperature of all combined battery in 5 min 50 sec means temp changes from 325 to 325.20 this is because there is energy stored in battery & some amount of energy is converted to heat while discharging which further conducted to battery body hence there is temp rise.
So here ΔT is "0.20" deg cel
So if we analyse the delta temperature we can see that during
CHARGING:- 0.30 > 0.23 > 0.15 for 298.15 , 310 , 325 respectively &
DISCHARGING:- 0.30 > 0.25 > 0.20 for 298.15 , 310 , 325 respectively
hence by observing we can conclude that when there is initial low temperature of battery very large amount of energy converted to heat instead of storage of energy but as temperature rises there is very small amount of temperature rise compare to initial , which means that at relative high temp more amount of energy is stored in form of chemical energy rather than converting to heat energy.
For SOC in charging condition we found that in all conditions we have initail 0 % but finally it goes to 90 % & for discharging conditions we found that in all conditions we have initail 100 % but finally it goes to 10 % , SOC have no significant changes observed.