Project 2 Thermal modeling of battery pack
For a 10 cell series lithium ion battery model, simulate the thermal effects and compare life cycle performance at various temperatures, charge & discharge rates using MATLAB.
ANR26650M1-B
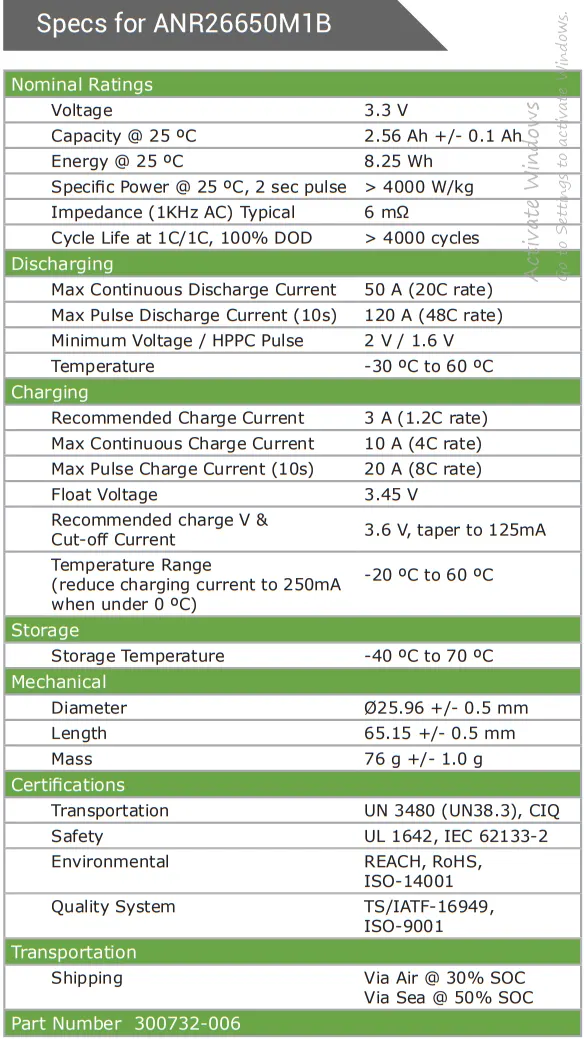
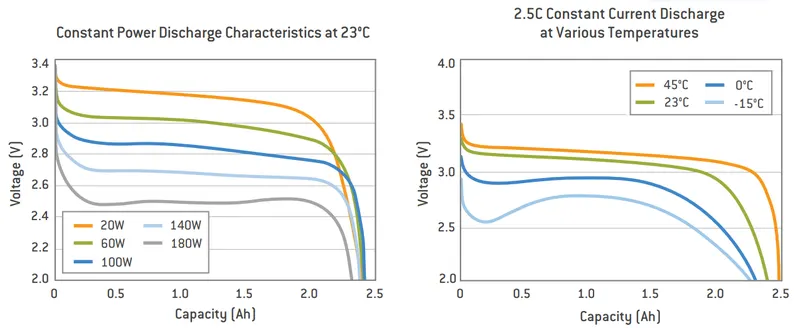
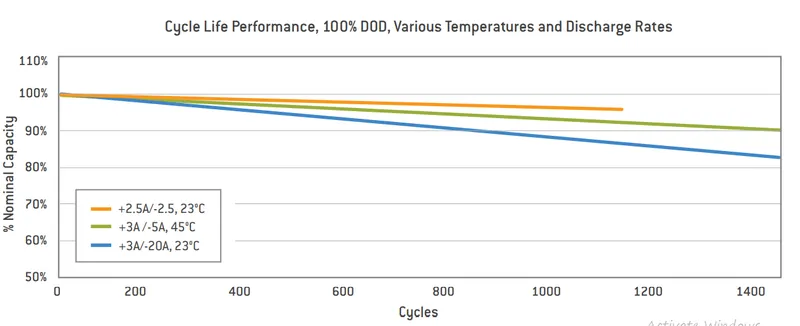
the bove figurre show how the capicity is getting less with increase in cycle time.
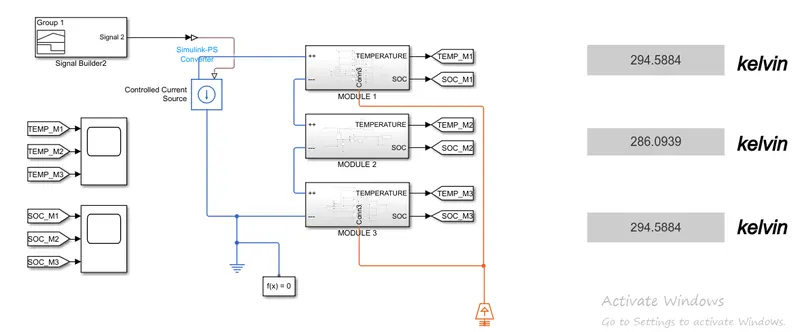
the above figure show the model of 10 cell connection module 1 consist of 5 cell which are connected in series module 2 consist of 1 cell module 3 consist of 4 cell in series all are connected in series. but the concept over here out of 10 cell one is given different temperature as compair to other to see the difference in temperature curve .
we can also add the resistance block if need .
signal builder provides the current input with respective to time and control current block use to control the flow of current.
temperature referance and solver configeration are must to run the simulation.
i will be running the simulation for 1369 sec because of the availabel input data.
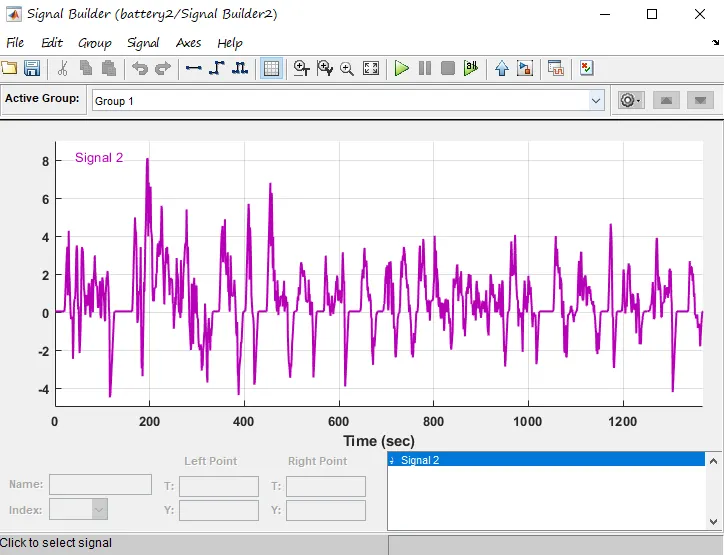
this is the input data provided in the builder block .
module 1 and module 3
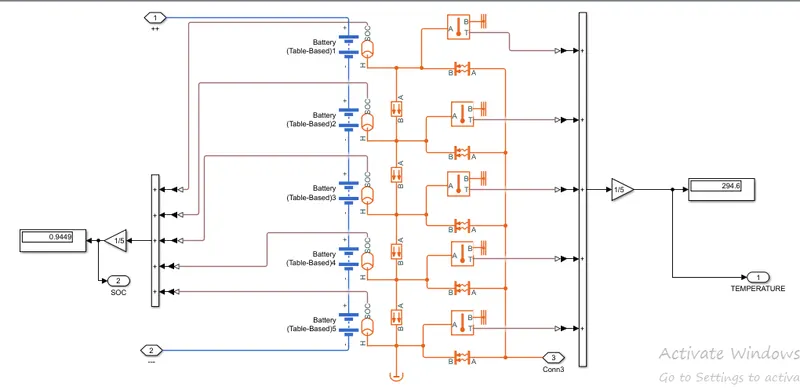
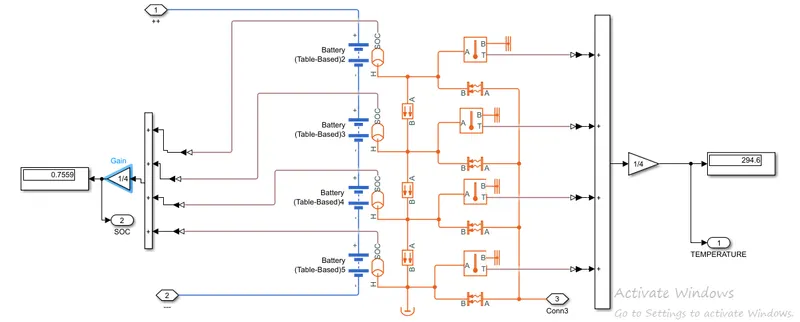
the above figure is of module 1 and 3 every each battery are connected in series we are adding the all SOC and multiplying them with 1/5 so that we can get the values of soc from 1 to 0
for the temperature part we are providing the temperature source through the Convective Heat Transfer from where we can change the area of contact.
also we are using an Conductive Heat Transfer block and Perfect Insulator block which are not mandatorey but an battery should have this.
an temperature sensor is used tho sense the temperature difference with respective to time and give the values.
aadding all the values and then multiplying it by 1/5 for getting the average of it.
module 2
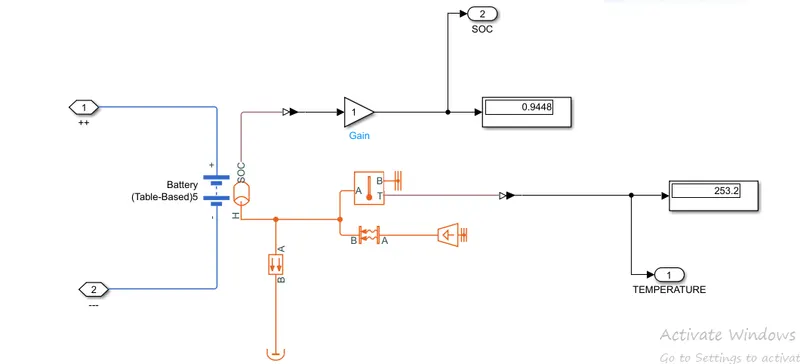
in this same concept is used but the temperature source is used seprately in this this is because we are providing different temperature as compair to other 9 cell to see the different reaction of this cell .
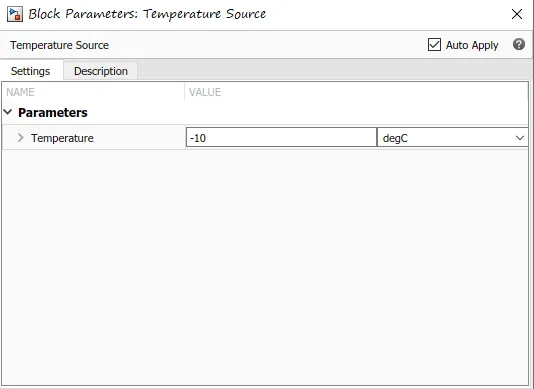
this the is inside of the temperature source we will run this simulation of 3 time with 3 different input temperature
for module 1 and 3 which is same temp source [ -10 15, 40]
for module 2 we are using temp [ -15, 20, 45]
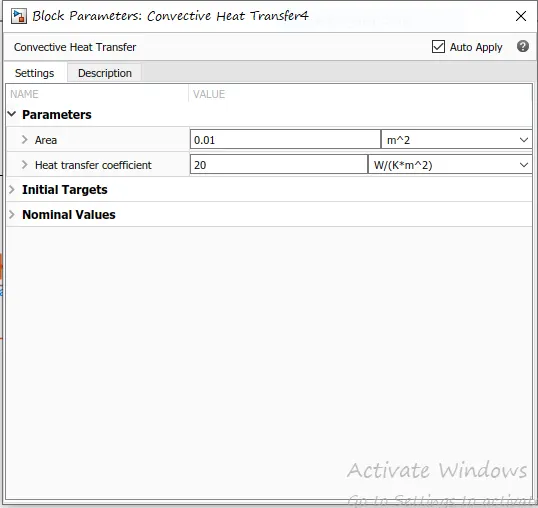
the above figure is of convective heat reansfer where we are providing the area of contact of the the temperture.
plots
TEMPERATURE AT 40 CELSIUS AND 45 CELSIUS
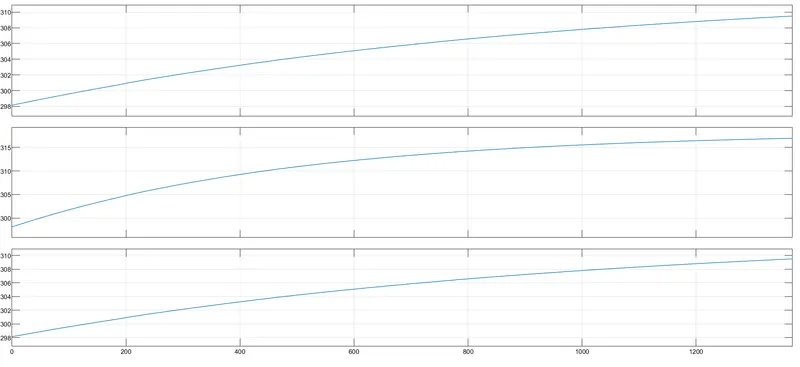
here we can see the temperature with same curve are of module 1 and module 3 this is because the the temperature source of both are same as while module 2 temperature is different due to seprate tremperature source is provided to it.
temperature is in increasing because the inside temperature of the cell is less which is 25 given while the temperature provided to it is higher which is 40 and 45 due to which we can see the temperature curve is in increasing form.
TEMPERATURE AT 15 CELSIUS AND 20 CELSIUS
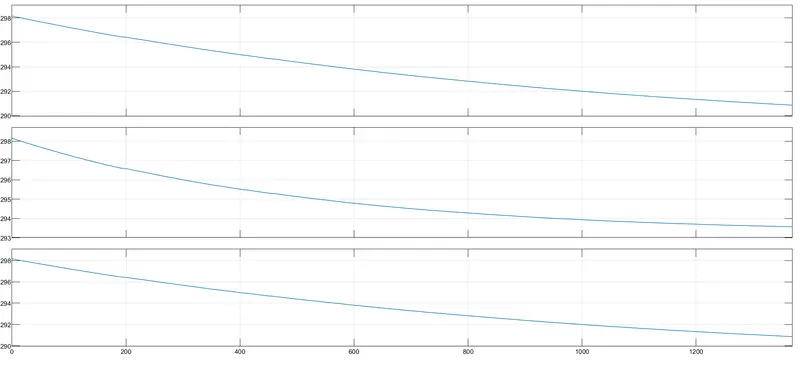
here we can see the temperature with same curve are of module 1 and module 3 this is because the the temperature source of both are same as while module 2 temperature is different due to seprate tremperature source is provided to it.
here the temperature is in dectreasing form this is because the internal temperature of the cell is 25 while the providing temperature is less than it which is 15 and 20 due to which we can see the drop in temperature.
SOC PLOT
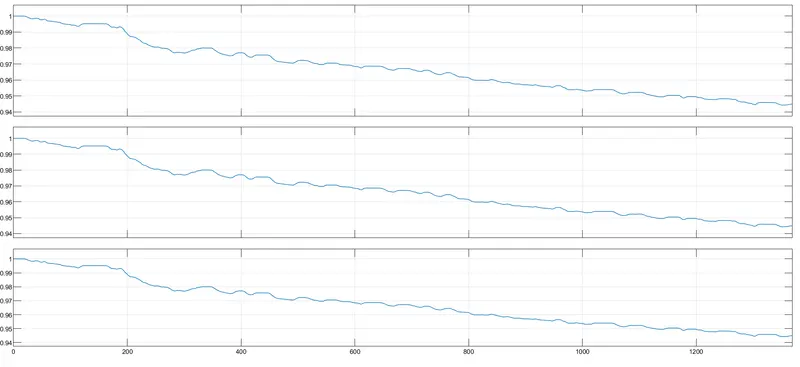
the soc plot will be same for both the case that is there is no change in soc due to temperature change because soc changes with the input current in the tabel battery .
thank you