Project 2 Thermal modeling of battery pack
AIM:
For a 10 cell series lithium ion battery model, simulate the thermal effects and compare life cycle performance at various temperatures, charge & discharge rates using MATLAB.
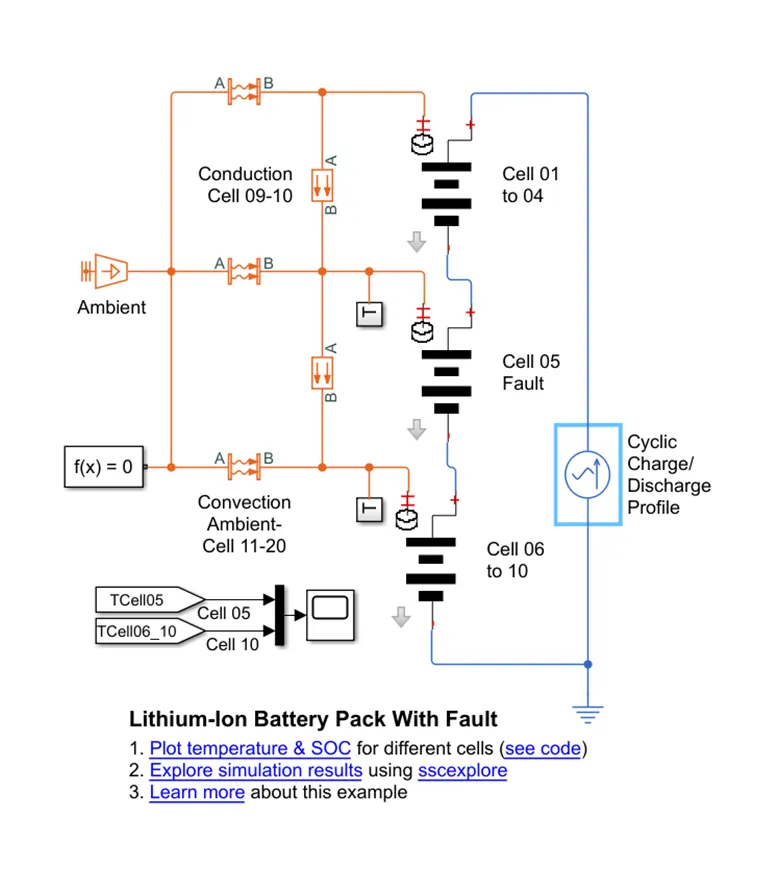
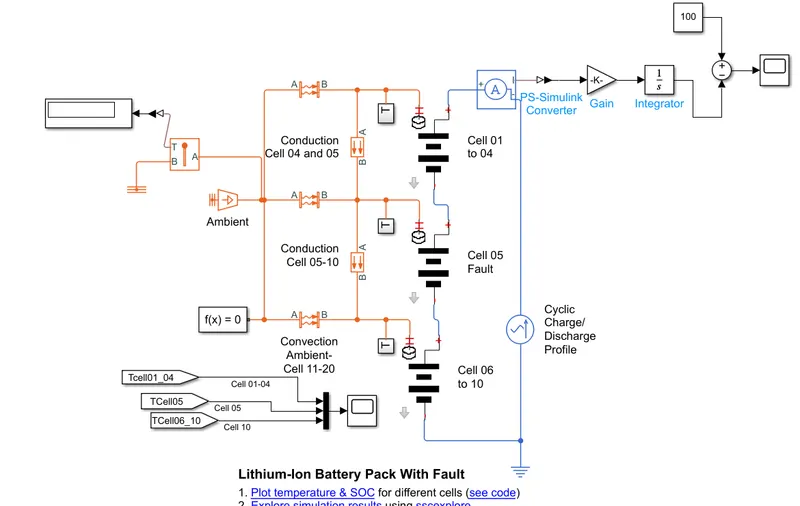
Below given example shows how to simulate a battery pack consisting of multiple series-connected cells efficiently.
It also shows how a fault can be introduced into one of the cells to see the impact on battery performance and cell temperatures.
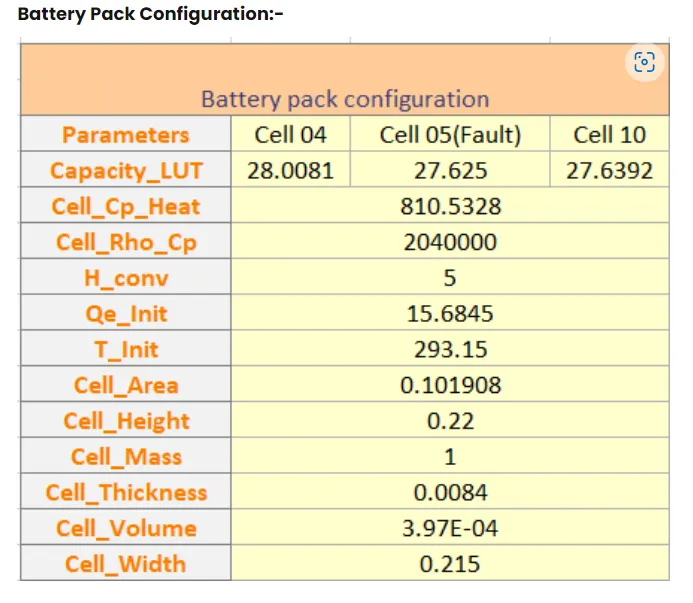
Here the fault is represented by changing the parameters for the Cell 10 Fault subsystem, reducing both capacity and open-circuit voltage,and increasing the resistance values ,here we actually made changes in the base model according to our requirements to obtain the results,
The model for simulation is taken from the matlab lithium ion battery model:
The configuration of the cells are shown below
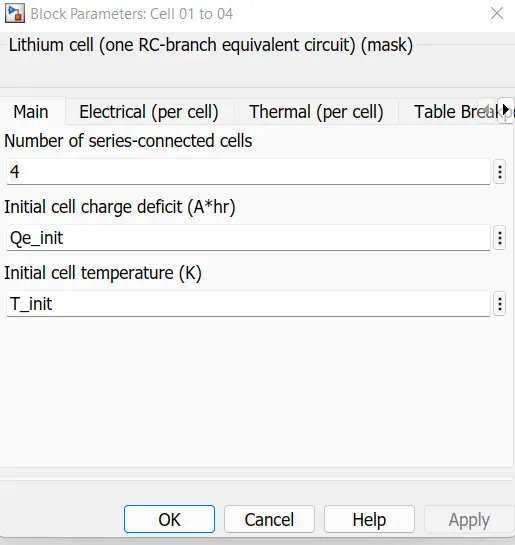
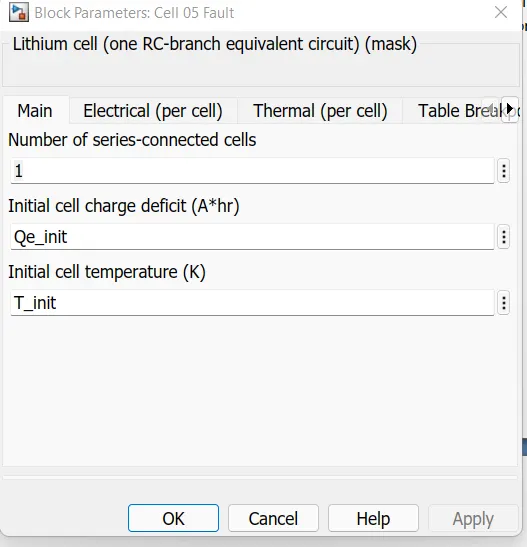
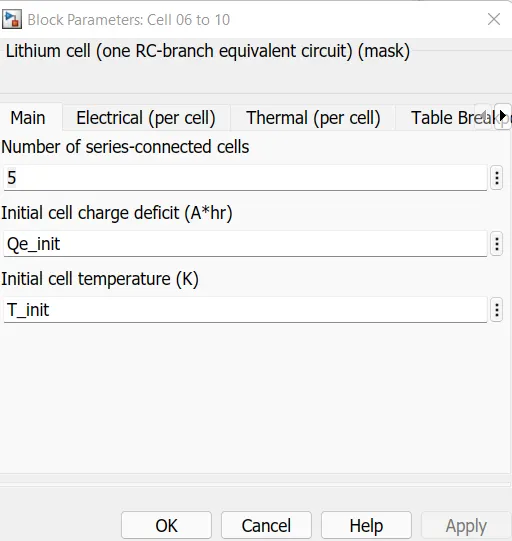
For simulating thermal effect of module, simulate a battery pack consisting of multiple series-connected cells in an efficient manner. It also shows how a fault can be introduced into one of the cells to see the impact on battery performance and cell temperatures. For efficiency, identical series-connected cells are not just simply modeled by connecting cell models in series. Instead a single cell is used, and the terminal voltage scaled up by the number of cells. The fault is represented by changing the parameters for the 10 Cells Fault subsystem, reducing both capacity and open-circuit voltage, and increasing the resistance values.
Simulink model
The blocks used in the model are,
Temperature sensor
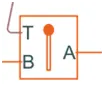
Temperature source

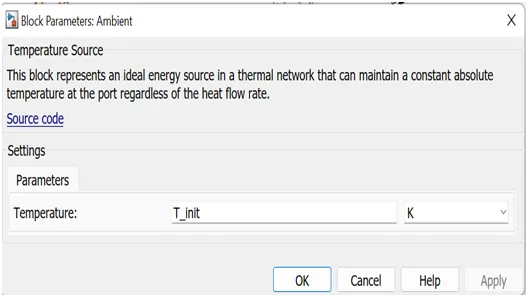
- Convective heat transfer

The rate of heat transfer is proportional to the temperature difference, heat transfer coefficient and surface area in contact with fluid
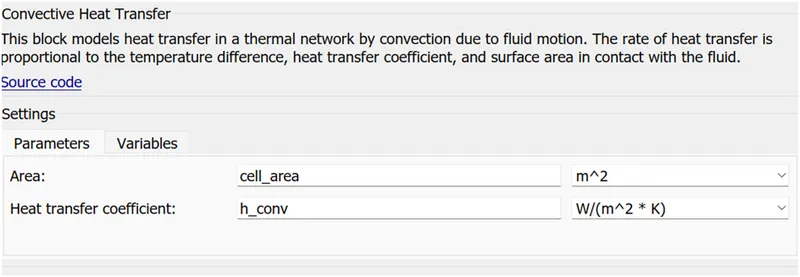
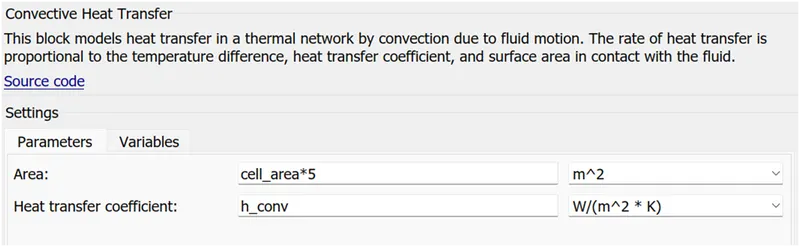
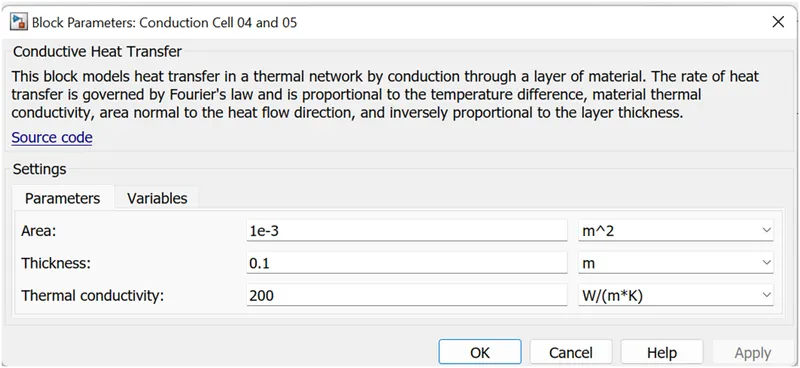
- Conductive heat transfer

- battery pack
Battery subsystem
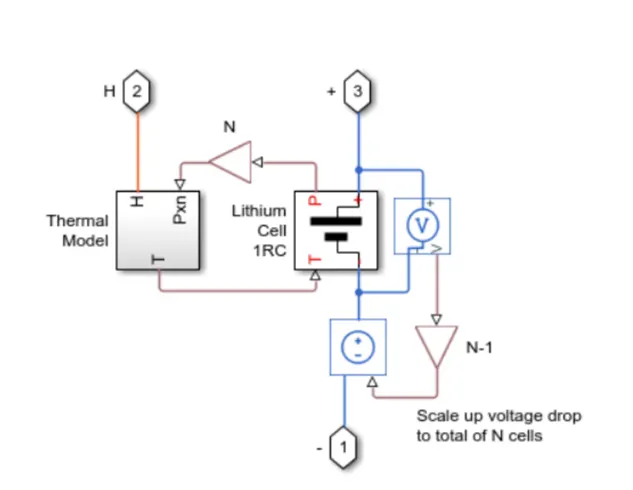
This consists of thermal model and lithium cell 1RC block which calculates temperature and thermal effect of the cell and overall calculation of the battery pack.
The ps gain block multiplies the input physical signal by a constant. Other blocks used are voltage sensor and current voltage sensor.
Lithium cell1 RC
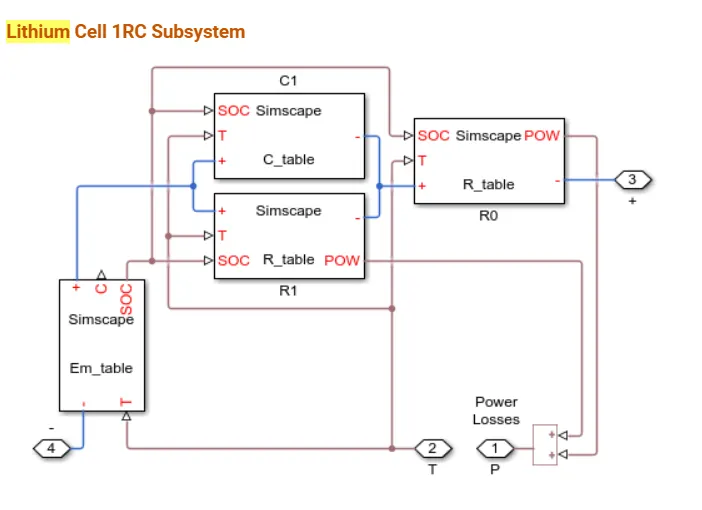
It consists of capacitor value table which depends upon the external physical signal input, SOC and T.
Capacitor value varies with time and hence the equation i=C*DV/dt.
Resistance value depends on the external physical signal inputs, SOC and T.
Voltage value (Em) implements the cell’s main branch voltage source and determines values for capacity and SOC.
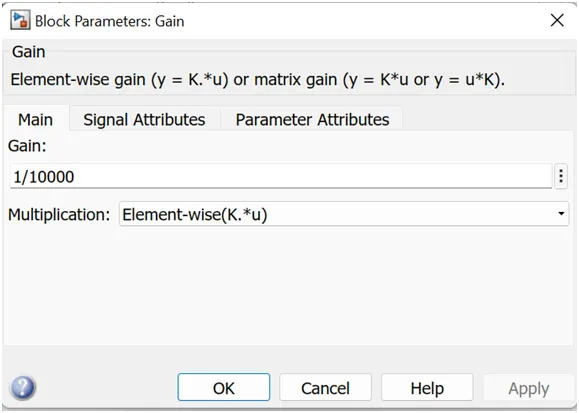
- Gain block
Output Waveform:
For the study we are getting results for different cell temperature
Here we have ambient temp to 299.1k or 25c

For test 1:
cell temperature:
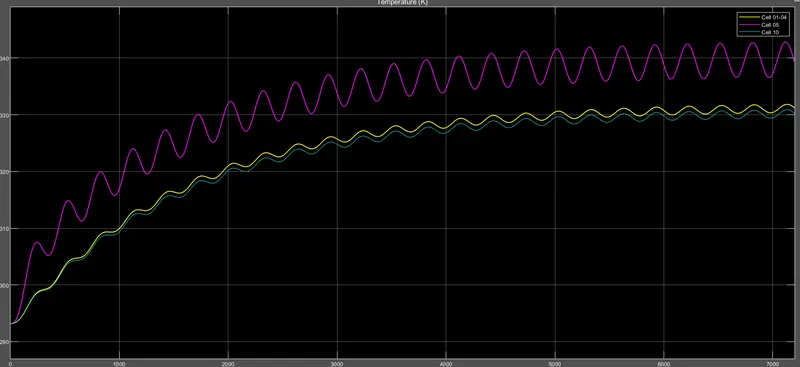
Here all the three the cell having the same temperature at the starting that is 299.1k.but in the beginning few seconds of simulation cell no 5 oscillates with more the cell 4 and 10 because of its design with fault and ranging to higher temp then cell 4 and 10.after a time period of around 1400 sec both the cells getting are unfollowing the temperature line which was following the same temperature rate,cell no 4 and 10 having approximately 325k(cell 10 having quite less temp then cell 04 because of no of the cells are different) at the end of the simulation and the cell no 5 achieving the higher temperature of around 340 k
SOC:
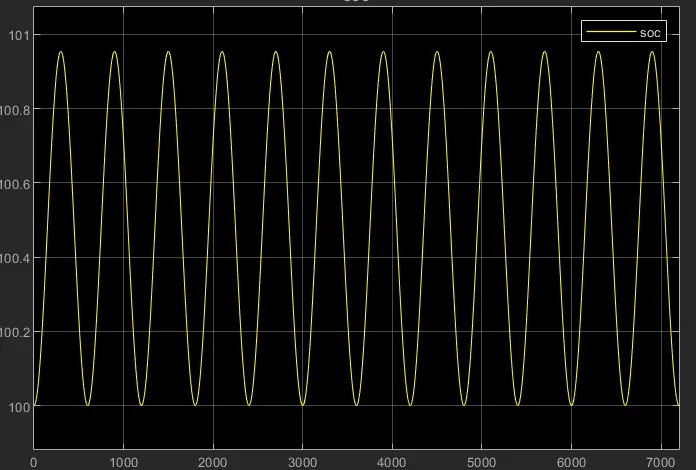
the soc graph following the sinusoidal waveform structure and fluctuating after 297 seconds and this waveform achieving the value of more than 100.09 soc
Test 2:

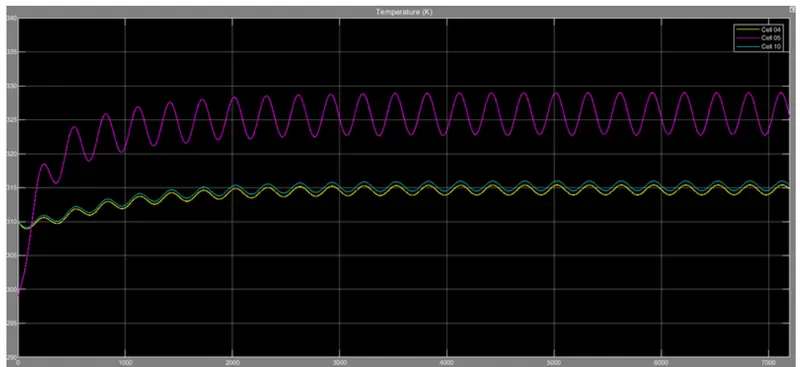
here the cell no 04 and cell no.10 starting from a temperature of 310 k at the start of simulation and cell no 5 from 299.1K with higher oscillation as compared to the other cells because of fault in design. here at the end of the simulation the cells 04 and 10 having the final temperature of nearby 315k and cell no 5 achieving the temp of 328k.
SOC:
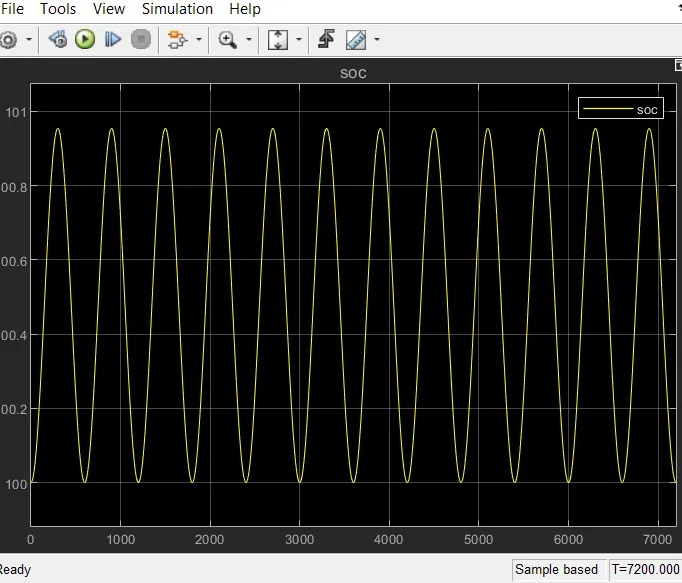
the soc graph following the sinusoidal waveform structure and fluctuating after 297 seconds and this waveform achieving the value of more than 100.09 soc
CONCLUSIONS:-
1.As the difference in temperature we can observe the changes in heat flow rate
2.SOC for all the temperature remaining same so there is no difference in SOC graphs
3.Cell no 5 had higher oscillation and we can observe that in every graph because we designed that particular cell for fault