Project 2 Thermal modeling of battery pack
Thermal modelling of battery pack:
A 10-cell series Lithium-Ion model images is shown below. It showcases a battery pack. Here in this model, we will simulate the thermal effects and compare State of Charge (SOC) and Temperature using charge and Discharge cycle at various temperature conditions.
Thermal modelling of battery pack is very important as it gives a clear idea about thermal behaviour of a battery pack which hold a very high value because it helps make a battery pack more reliable and safer specially in case of Lithium-Ion battery which can go thermal run away if not properly managed. A thermal run away will lead to fire which will destroy the Electric vehicle completely and a customer will lose a value money invested which will drive the masses away from using EVs.
EFFECT OF TEMPERATURE ON LITHIUM ION BATTERY:
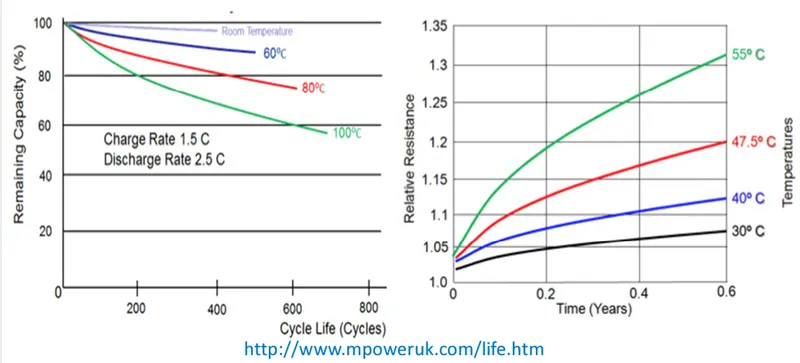
- High temperature reduces the life cycle of the battery.
- High temperature reduces the capacity of battery over time.
- The resistance of the battery increases over time with increase in temperature.
- Due to high temperature the cost to drive EVs over time increases.
The below image will summarise the above points.
TEPERATURE IMPACT ON EVs:
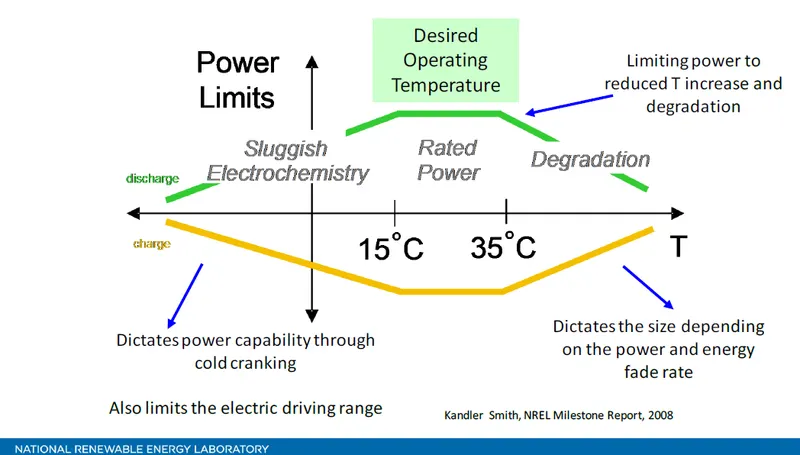
- High temperature degrades the life of lithium-ion battery more quickly.
- Lower temperature ranges reduce the capacity and power of the lithium-ion battery.
- Proper temperature range between 15 °C to 35 °C gives the rated power and capacity.
The below image will give a clear idea about the above points.
For normal operation of an Electric Vehicles a Battery Management System and a Thermal Management system is needed.
Battery Management system is the main brain of the battery pack and Thermal Management system is a subsystem of Battery Management system (BMS) which reports temperature of each cell, module and pack to BMS then BMS takes all the necessary action to bring the temperature of battery pack at optimal temperature range by performing several operations like checking for voltage, current and temperature of each cell and selecting right action for Battery Cooling System. BMS also serves as data centre for reporting and calculating.
BATTERY THERMAL MANAGEMENT SYSTEM
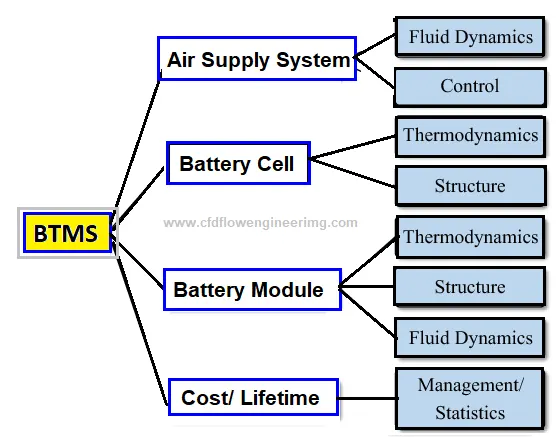
- The high battery temperature leads to poor performance, short lifetime, and risk of blasting. Therefore, a BTMS is essential for all battery modules.
- The main purpose of a BTMS is to maintain the battery system in the optimum temperature range and keep uniform temperature variation in the battery modules.
- Prevent the cells from going above or below acceptable limits.
- It should help to maximize the useful energy contribution from each cell.
The following figure shows the most used thermal management techniques for battery module.
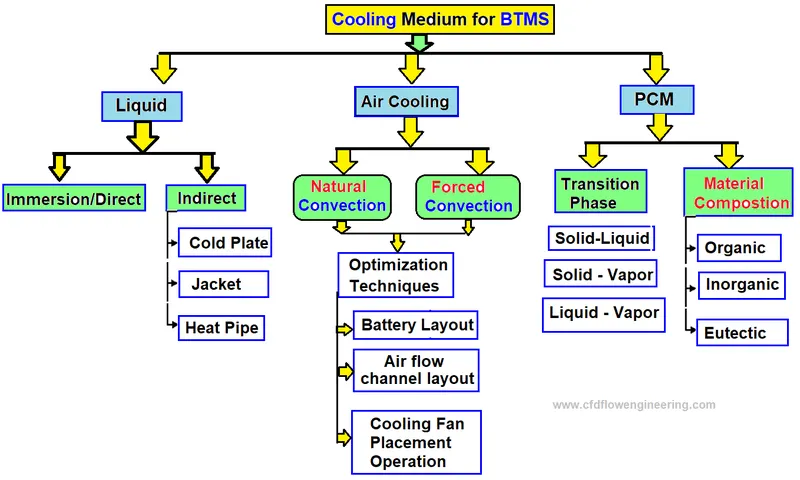
For better adaption to EVs, BTMS must ensure features such as high performance, simplicity, low weight, reduced cost, fast packaging and easy maintenance. Two types of battery cooling systems (BCS) are common which are external or internal. External Battery cooling systems (EBCS) are classified into several different ways
Battery cooling can be categorized based on the method or technique.
THE MODEL OF 10 CELL IN SERIES FOR THERMAL OBSERVATION:
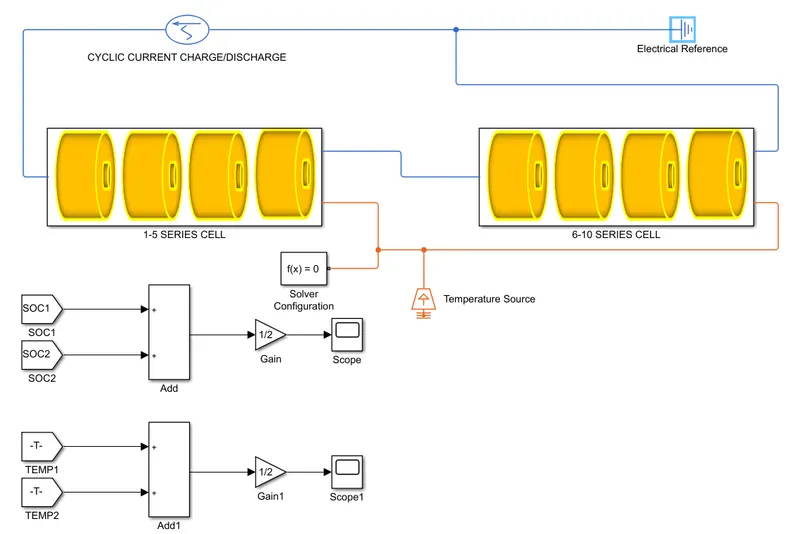
In the above model an AC Current source block is used for giving cyclic input of current for charging and discharging the battery in series. Two Subsystem Block is used where 10 cells are arrange in series along with thermal network. An Electrical Reference Block it represents the Electrical ground for all the electrical elements, Electrical conserving ports of all the blocks that are directly connected to ground must be connected to an Electrical Reference block. A model with electrical elements must contain at least one Electrical Reference block. Solver Configuration Block it specifies the solver parameters that the model need before the simulation begins. Temperature Source Block is use to give a temperature to 2 subsystem blocks where the battery is connected in series. Gain Block is used to get the average from the input signal along with these blocks Goto and from block are used to get the signals from Subsystem Blocks.
The two subsystem blocks are connected in series and signal is given using AC Current source.
SUBSYSTEM FOR CELLS IN SERIES 1-5:
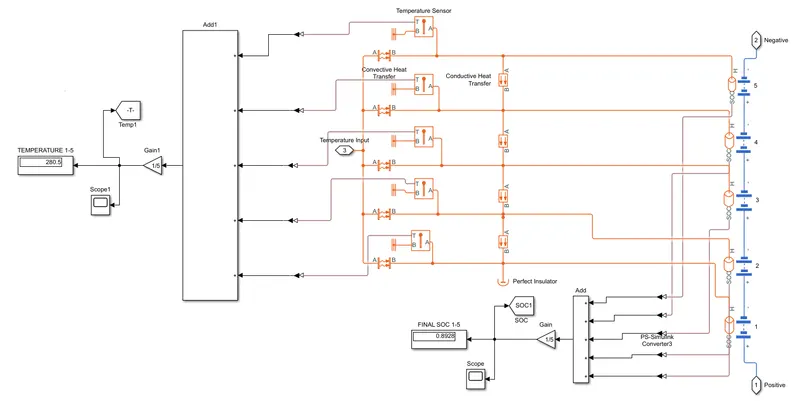
In the above Subsystem Model 1-5 cells are connected in series there instrumented and thermal ports are On. For thermal modelling the blocks that are used are as follows:
- Conductive Heat Transfer Block - The Conductive Heat Transfer block represents a heat transfer by conduction between two layers of the same material. The transfer is governed by the Fourier law
- Convective Heat Transfer Block - The Convective Heat Transfer block represents a heat transfer by convection between two bodies by means of fluid motion.
- Temperature Sensor Block – It is an ideal temperature sensor block that differentiate in temperature between 2 points without drawing any heat. Connections A and B are thermal conserving ports that connect to the two points where temperature is being monitored.
- Perfect Insulator Block - The Perfect Insulator block represents a thermal element with perfect insulation and no thermal mass.
- Thermal Reference – It represents thermal reference point that is a point with an absolute zero temperature with respect to which all the temperatures in the system are determined.
The working of mechanism of Subsystem:
The thermal network collects temperature data and does all operation during simulation and sends it to addition block where all the temperature are added up. Then the Gain block divides the signal by 5 to get an average temperature of five cells which is the given to Goto block so that it can be send outside the subsystem to scope using From Block.
The SOC of 5 cells in series is collected and added up which is again divided by 5 using gain block cause the capacity of cells in series cannot be added up. The signal from the gain block is fed to Goto Block so that it can be send outside the subsystem to scope using From Block.
The same Blocks are used in Subsystem 2 which contain 6-10 cells in series and it has same working mechanism. The Subsystem 2 is shown below.
SUBSYSTEM FOR CELLS IN SERIES 6-10:
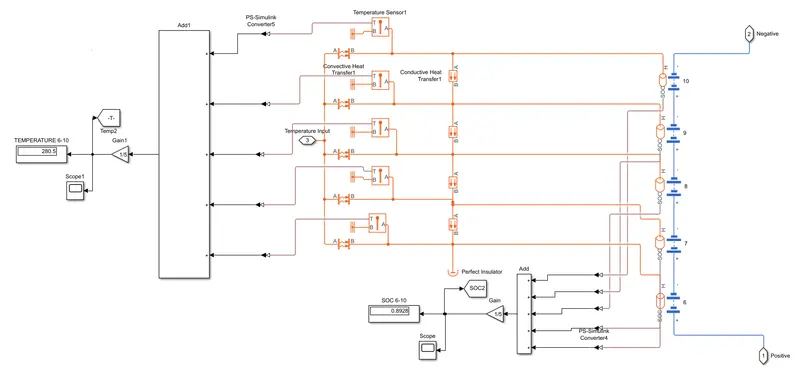
The model is simulated for 2 test cases.
- When all the cells are at same temperature that is 273 Kelvin
- When all the cells are at different temperature.
Frome these test case we will observe our results.
OBSERVATION:
For Test Case 1.
1.) SOC Graph:
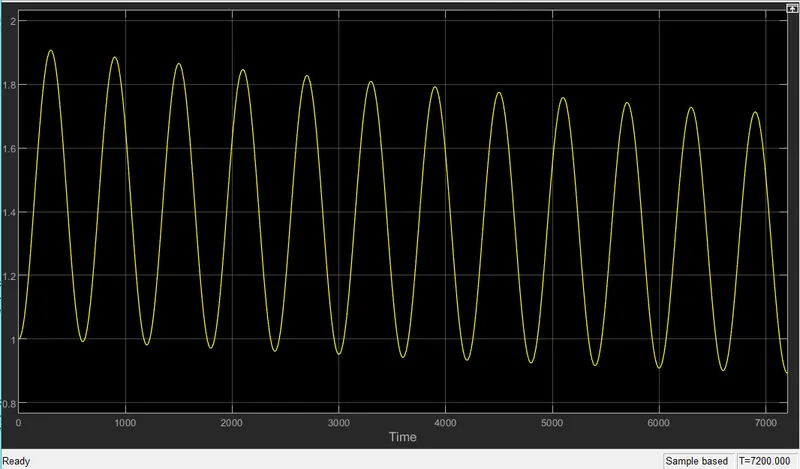
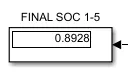
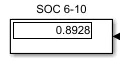
The above image shows that the SOC is increasing and decreasing due to cyclic current input. The simulation is done for 7200 seconds. At the end of simulation, the SOC falls below 1. The below image shows the value of SOC at the end off simulation.
2.) Temperature Graph:
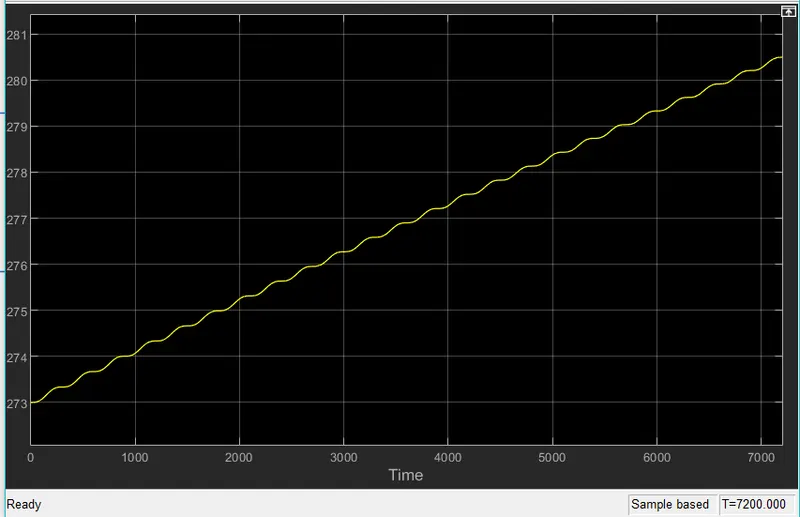
The above image shows temperature of the 10 cells in series when all the cells are at same temperature that is 273 kelvin. We can observe that the temperature increases from 273 kelvin to 280.5 kelvin. The simulation is done for 7200 seconds.
The below images show the temperature for two subsystems. In the model a gain block is use where the signal is divided by 2 after adding cause if two points are at same temperature then they cannot be added thermodynamically.
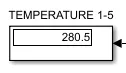
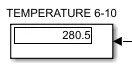
Both the subsystem have same temperature cause all the cells have same temperature.
For Test Case 2:
The below table show the different cell temperature which is used in this case.
|
Cell 1 |
Cell 2 |
Cell 3 |
Cell 4 |
Cell 5 |
Cell 6 |
Cell 7 |
Cell 8 |
Cell 9 |
Cell 10 |
|
288 k |
273 k |
293 k |
298 k |
283 k |
300 k |
282 k |
273 k |
285 k |
290 k |
1.) SOC Graph:
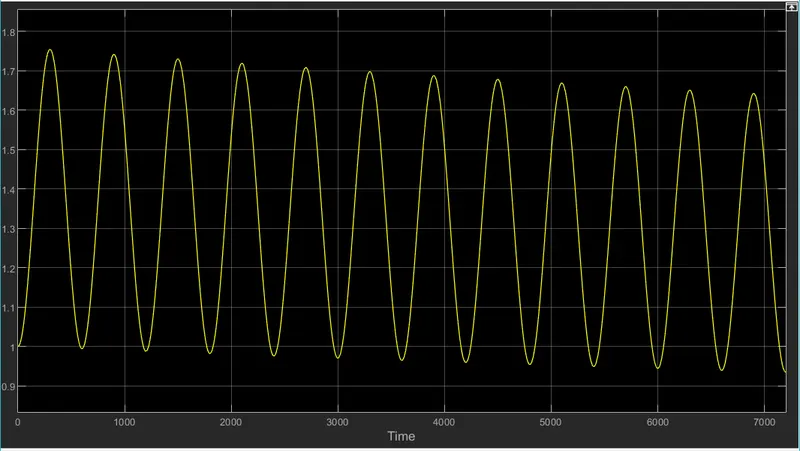
The above image shows the soc which is changing due to cyclic current input. That resembles the charge and discharge cycle. The simulation is done for 7200 seconds. At the end of simulation, the SOC falls below 1. It is just same as Test case 1.
2.) Temperature Graph:
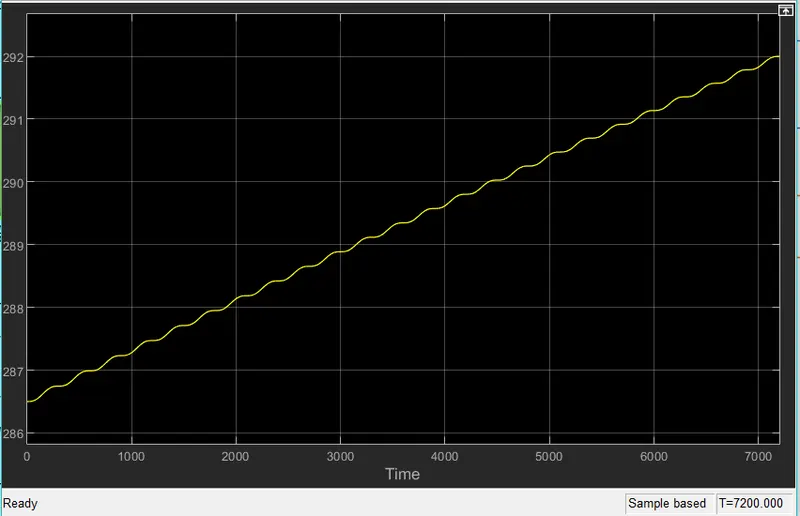
The above image shows temperature of the 10 cells in series when all the cells have different temperature that is shown in above table. We can observe that the temperature increases from 286.5 kelvin to 291.6 kelvin. The simulation is done for 7200 seconds. The graph above shows the average temperature in this case.
The below images show the temperature for two subsystems. In the model a gain block is use where the signal is divided by 2 after adding so that an average temperature graph can be obtain through out the simulation. Inside the subsystem it is divided by 5 in the gain block so as to get average of 5 cells.
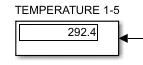
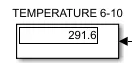
Both the subsystems have different average temperature due different cell temperature.