Project 2 Thermal modeling of battery pack
Report
AIM: Thermal Modeling of Battery Pack.
Objective:
- For a 10 cell series lithium ion battery model, simulate the thermal effects and compare life cycle performance at various temperatures, charge & discharge rates using MATLAB.
Introduction:
The performance and life-cycle costs of electric vehicles (EV) and hybrid electric vehicles (HEV) depend inherently on energy storage systems such as batteries. Battery pack performance directly affects the all electric range, power for acceleration, fuel economy, and charge acceptance during energy recovery from regenerative braking. Because the battery pack cost, durability, and life also affect the cost and reliability of the vehicle, any parameter that affects the battery pack must be optimized.
Temperature and temperature uniformity have a strong influence on battery pack performance and consequently, that of HEVs and EVs. All the modules in the pack should be operated within the optimum temperature range suitable for the particular electrochemical couple used. In addition, uneven temperature distribution in a pack leads to different charge/discharge behaviour that results in unbalanced modules and reduced pack performance . Because HEV batteries have high specific power and undergo aggressive HEV charging/discharging profiles, thermal issues in an HEV pack are of more concern than in EV packs.
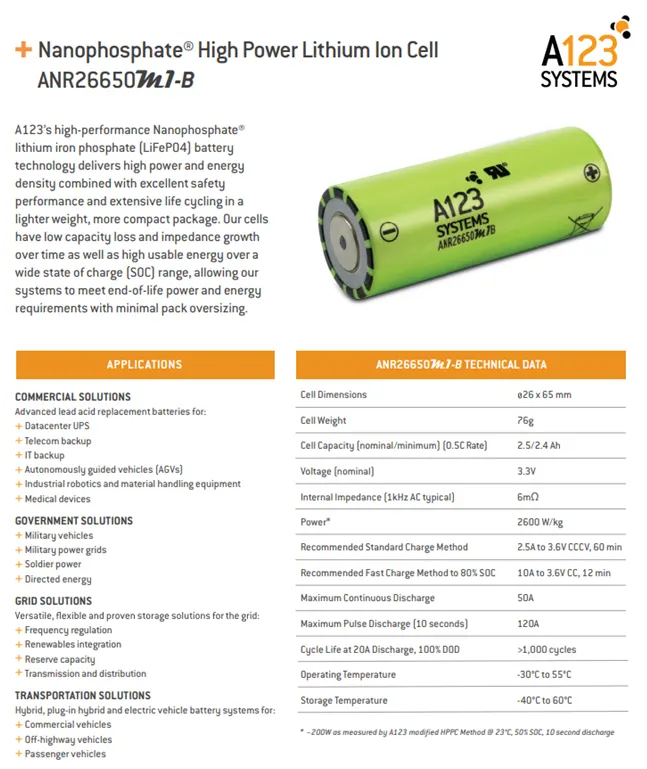
In this project will simulate the thermal effect of a 10S1P lithium-ion battery pack,which consist of 10 ANR26650m1-B high-performance Nanophosphate lithium iron phosphate (LiFePO4) battery technology delivers high power and energy density combined with excellent safety performance and extensive life cycling in a lighter weight, more compact package. to make its interesting,a fault has been introduced in one of the cell to demonstate the effect of the faulty cell on the entire pack.
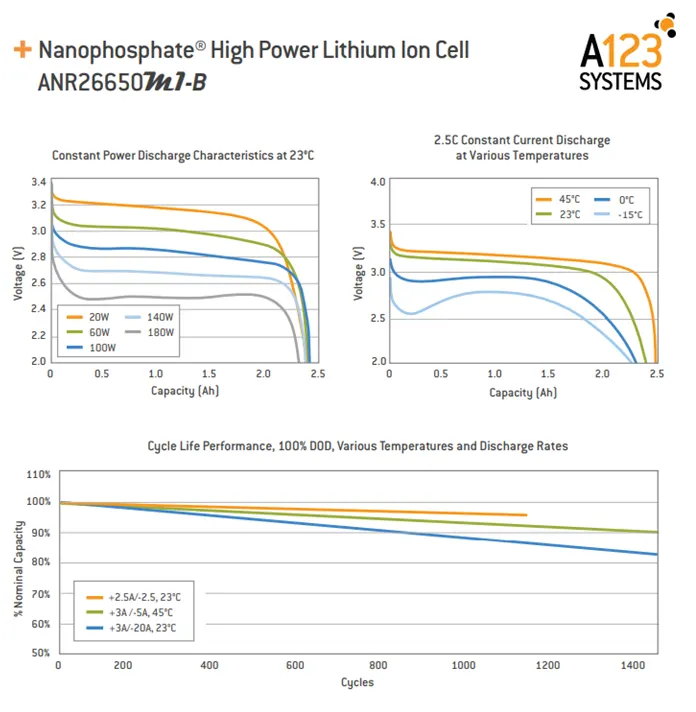
ANR26650m1-B Nanophosphate lithium iron phosphate (LiFePO4) datasheet used for this project:
What is Fauly Cell ?
A faulty cell demonstates performance that is different than the other cell usually most cell will be displaying the same SOC ,temperature voltage level etc.but a faulty cell will show sign of overheating,faster discharge(due to reduced capacity or reduced OCV) oe will be unbalanced cell.this will be impact the performace of the entire pack as the faulty cell will limit the pack from utilizing its maximum potential.

in this project the faulty cell is repesenting by adding an extra external resistor.this will make the cell react diffirently then the other cells.
Simulink Model:
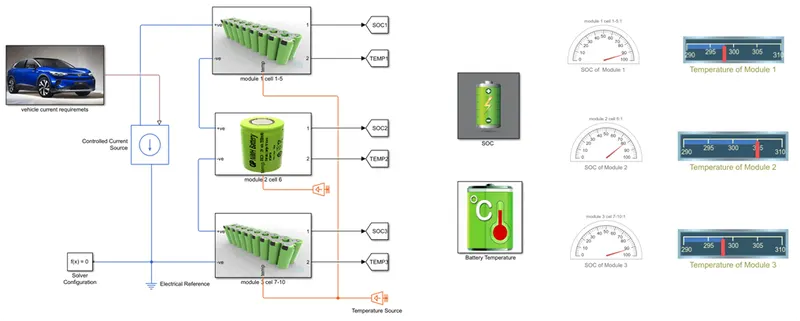
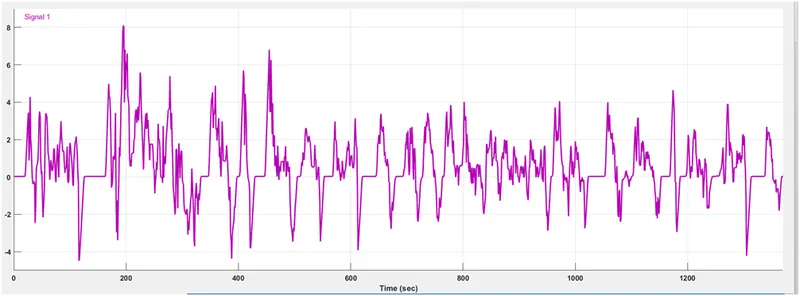
- in this model 1st we give UDDS current profile to battery pack with help of signal builder block.
- UDDS cycle (current vs time) has been used to charge discharge the batteries for given periode og time 1370 sec.
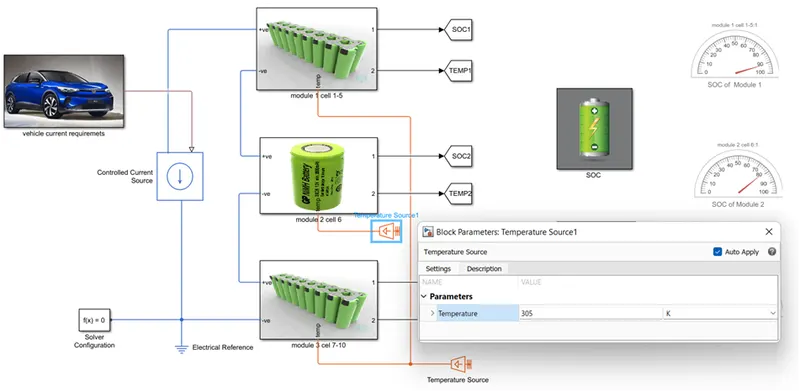
- there is three module hav been connected together in series to make a 10 cell battery pack model.
- in cell no.6 a resister can be added to vary the rate of discharge.
- all cell are configure same as ANR26650m1-B cell .it means put same value which in datasheet.
- all cell are iniially at 25 degree c.a temp.source is used to test the cell performance at 3 different atm.temperature,like At 25oC,At 45oC,At -10oC .
- convective and conductive block hae been added for heat transfer between blocks.
vehicle Current Model:
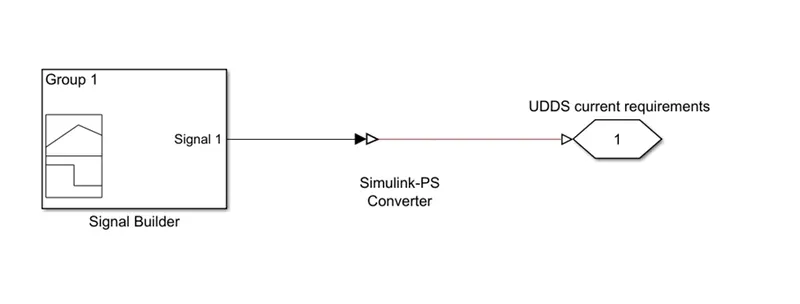
- In vehicle current requirement subsystem block,the signal builder block used to apply UDDS current profile and simulink-ps converter block used to convert the simulink signal to physical signal.connectin port block used to output the signal.
MATLAB Code:
clear all
close all
clc
f1 = xlsread('UDDS current profile (2).xlsx');
time = f1(:,1);
current= f1(:,2);
UDDS Current Profile in Signal Builder:
Module 1 [Cell 1-5]:
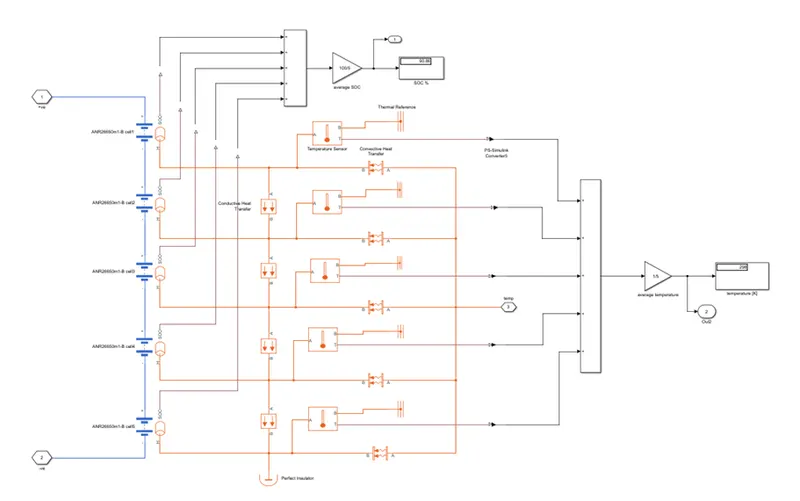
- In this module we used the 5 table based battery block in which we put the datasheet value on it.here i put the battery specification like, 2.5Ah capacity,initial temp.value is 298K etc.and this 5 cell are connected in series.
- also here we use the conductive heat transfer block in which we put the thermal conductivity is 401 W/(K*m),area is 10 m^2,and thickness is 0.1m.
- here we use the convective heat transfer block in which we put the heat transfer co-efficients is 20 W/(K*m^2),area is 10 m^2.and one end of this block is connected to thermal source and other is connected to perticular cell.
- here we use perfect insulator also.
- here we use temperature sensor to sense the temperature of cell and display the value in scope and dashboard.also it one end connected to thermal referance.
- and SOC of every cell is also calculate by using add and gain block,and display the soc value in % in display block.
Module 2 [Cell 6]:
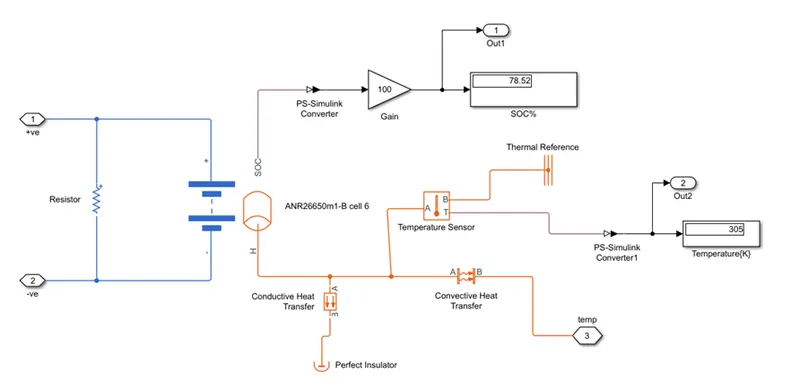
- In this module we used the table based battery block in which we put the datasheet value on it.here i put the battery specification like, 2.5Ah capacity,initial temp.value is 298K etc.and addition to that accross the battery terminal we use the 5 ohms resistor to show the this is the faulty cell.
- also here we use the conductive heat transfer block in which we put the thermal conductivity is 401 W/(K*m),area is 10 m^2,and thickness is 0.1m.
- here we use the convective heat transfer block in which we put the heat transfer co-efficients is 20 W/(K*m^2),area is 50 m^2.and one end of this block is connected to thermal source and other is connected to perticular cell.
- here we use perfect insulator also.
- here we use temperature sensor to sense the temperature of cell and display the value in scope and dashboard.also it one end connected to thermal referance.
- and SOC of every cell is also calculate by using add and gain block,and display the soc value in % in display block.
Module 3 [Cell 7-10]:
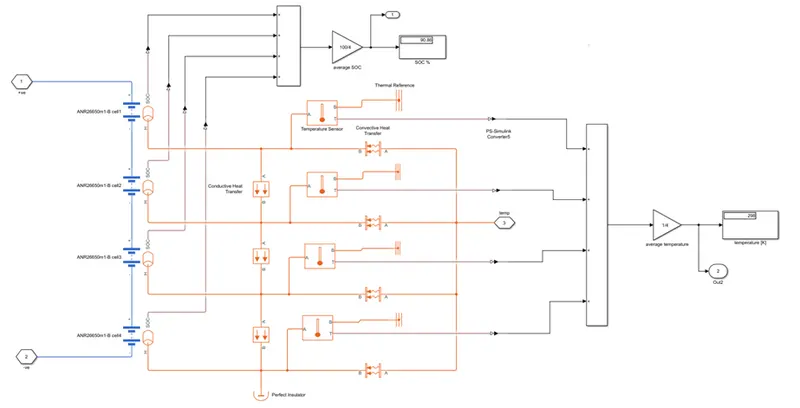
- In this module we used the 4 table based battery block in which we put the datasheet value on it.here i put the battery specification like, 2.5Ah capacity,initial temp.value is 298K etc.and this 4 cell are connected in series.
- also here we use the conductive heat transfer block in which we put the thermal conductivity is 401 W/(K*m),area is 10 m^2,and thickness is 0.1m.
- here we use the convective heat transfer block in which we put the heat transfer co-efficients is 20 W/(K*m^2),area is 10 m^2.and one end of this block is connected to thermal source and other is connected to perticular cell.
- here we use perfect insulator also.
- here we use temperature sensor to sense the temperature of cell and display the value in scope and dashboard.also it one end connected to thermal referance.
- and SOC of every cell is also calculate by using add and gain block,and display the soc value in % in display block.
SOC Calculation Model:
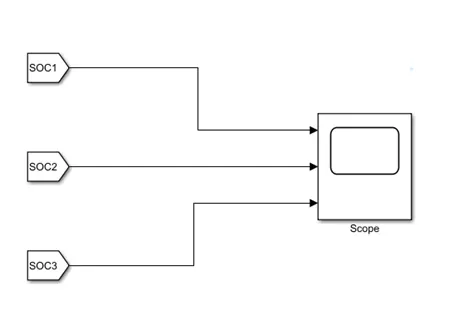
- here we use the 3 goto block and 3 from block and scope to analyze the change in soc of 3 different cell module.
Temperature Calculation Model:
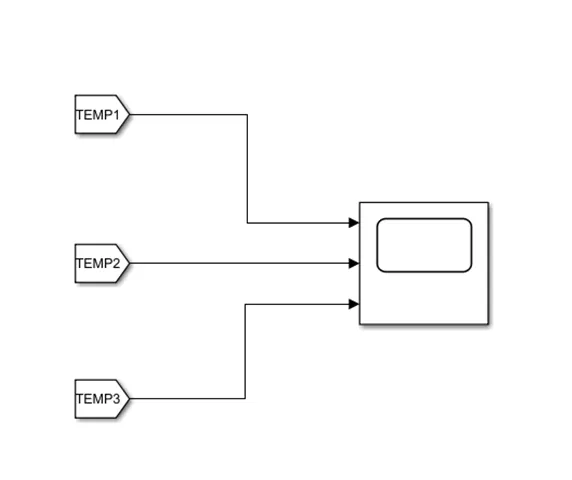
- here we use the 3 goto block and 3 from block and scope to analyze the change in temperature of 3 different cell module.
To incorporate for the positioning of this cell(center of pack) certain changes have been made:
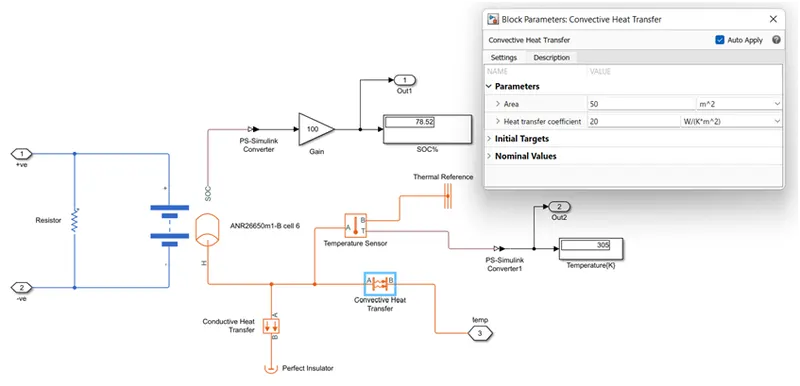
- the convective area is 10 m^2 for the remaining 9 cell,but has been increased to 50m^2 here.
- the ambient temperature provided from temperature source to the ramaining 9 cell are the same 298K,but has an increament of 7K for this cell.its means 305K.
Result:
A] At 25oC:
1] SOC OF Different Module [%]:
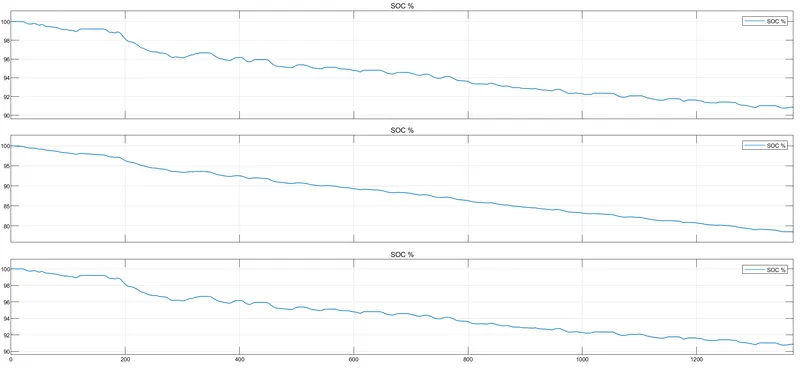
- model 2 has a much steeper slope than the others bcoz of added 5 ohmc resistor.a load(in the form of resistor) with a resistance of just 5 ohms will draw in more current compared to no added load.wich means greater rate of discharge and hence more drainage of SOC.
2] Temperature Change In Module [K]:
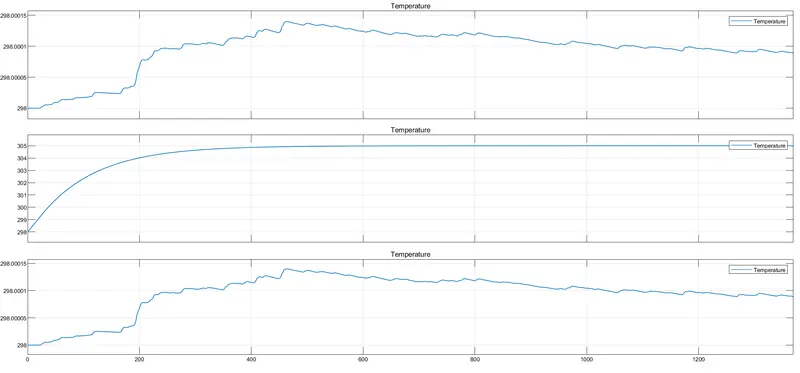
- Initial temperatre of batery pack is set to 298K.
- much steeper rise in temperature of module 2 compared to other module due to increased surface area contact and its position being in the center of the battery pack.
- although ambient temperature supplied is 298K,module 2 reaches 305K (while the other cell are at 298K) for the aforementioned two reasons in addition to the fact that there is also added 5ohms resistance in mode 2.
3] Dashboard for Indication of SOC and Temperature Change:
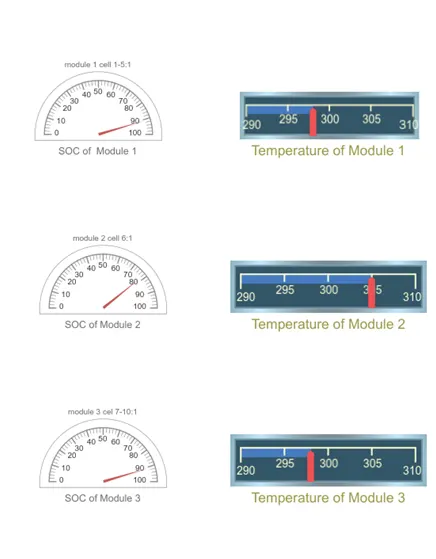
- both the gauge showing the change in SOC and change in Temperature.
B] At 45oC:
1] SOC OF Different Module [%]:
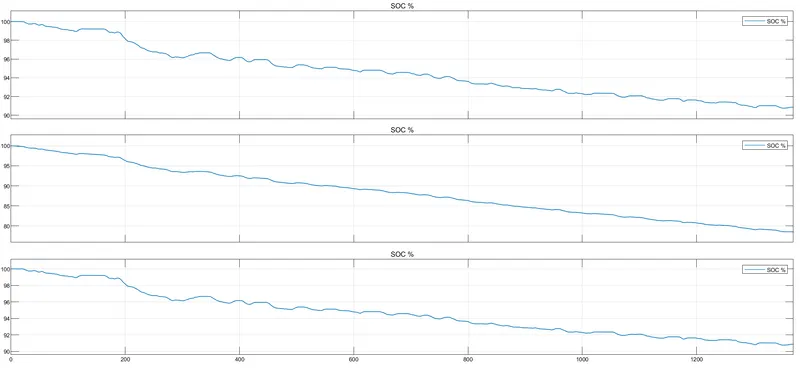
- model 2 has a much steeper slope than the others bcoz of added 5 ohmc resistor.a load(in the form of resistor) with a resistance of just 5 ohms will draw in more current compared to no added load.wich means greater rate of discharge and hence more drainage of SOC.
2] Temperature Change In Module [K]:
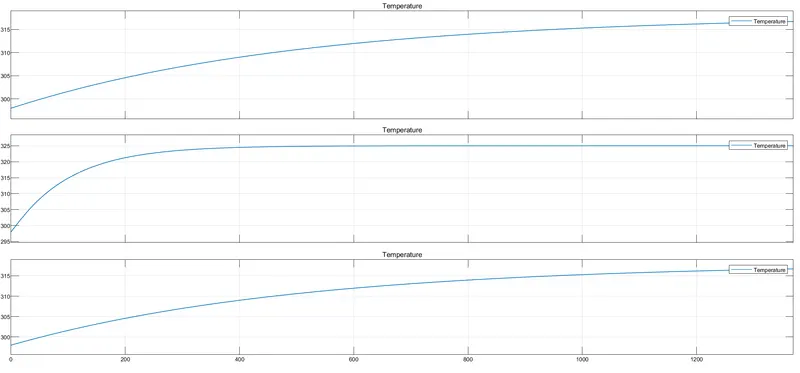
- Initial temperatre of batery pack is set to 298K.
- much steeper rise in temperature of module 2 compared to other module due to increased surface area contact and its position being in the center of the battery pack.
- although ambient temperature supplied is 318K,module 2 reaches 325K (while the other cell are at 318K) for the aforementioned two reasons in addition to the fact that there is also added 5ohms resistance in mode 2
3] Dashboard for Indication of SOC and Temperature Change:
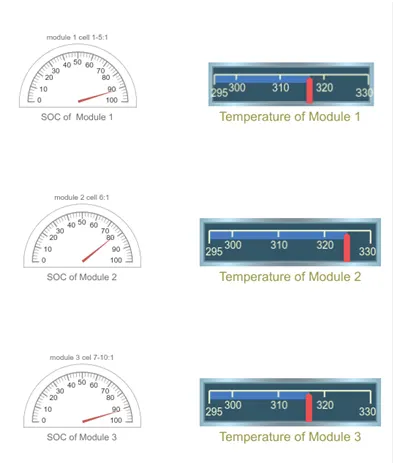
- both the gauge showing the change in SOC and change in Temperature.
C] At -10oC:
1] SOC OF Different Module [%]:
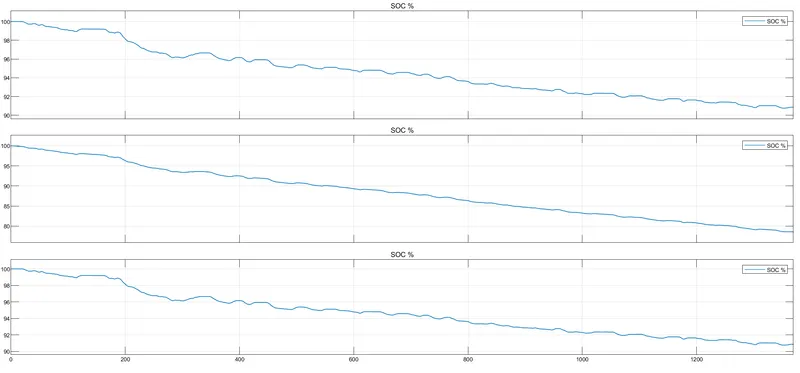
- model 2 has a much steeper slope than the others bcoz of added 5 ohmc resistor.a load(in the form of resistor) with a resistance of just 5 ohms will draw in more current compared to no added load.wich means greater rate of discharge and hence more drainage of SOC.
2] Temperature Change In Module [K]:
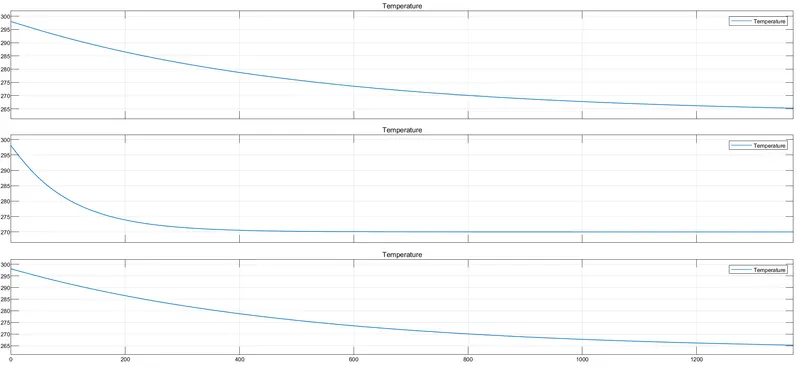
- Initial temperatre of batery pack is set to 298K.
- much steeper fall in temperature of module 2 compared to other module due to increased surface area contact and its position being in the center of the battery pack.
- although ambient temperature supplied is 263K,module 2 reaches 270K (while the other cell are at 263K) for the aforementioned two reasons in addition to the fact that there is also added 5ohms resistance in mode 2
3] Dashboard for Indication of SOC and Temperature Change:
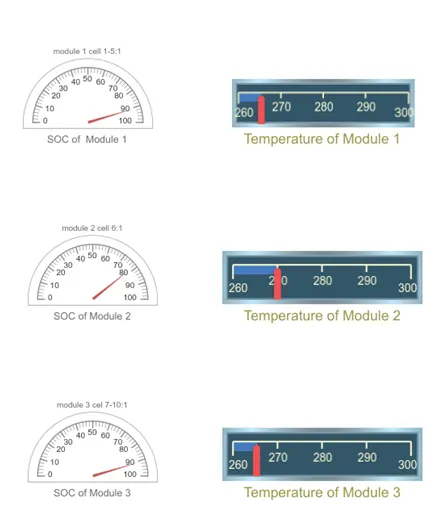
- both the gauge showing the change in SOC and change in Temperature.