Project 2 Thermal modeling of battery pack
For a 10 cell series lithium ion battery model, simulate the thermal effects and compare life cycle performance at various temperatures, charge & discharge rates using MATLAB.
Introduction:-
EVs, HEVs and PHEVs are powerd by lithium ion cells which are fitted together in a battery pack with particular series and parallel arrangements. These arrangements and the number of cells in a battery pack are designed based on the power requirement of the vehicle. During the design stage of a battery pack, the cells in the pack are tested to simulate their thermal effects and life cycle performance under various conditions. These conditions ae real life situations that the battery pack may operate at when in use in a vehicle by a user and these tests are performed to observe how the cells behave. The condition will test the battery pack at normal operating levels as well as at their extremes for instance the battery pack may be tested under different and discharging rates, different temperature etc. As per the specifications of lithium ion cells, it is very important that the application of the cells follows the charging/discharging rates as well as the temperature range. Discharging these operating ranges will result in the accelerated degradation of the capacity and working life of the cell or worse- a thermal runway effect so it is very important that the manufacturers of EVs, HEVs, and PHEVs perform the thermal modelling of a battery pack before implementing it.
1. Constant current charging
2. Cyclic charging/discharging
3. Drive cycle
For each configuration, there will be a slight change in the Simulink model with respect to the load given to the battery packs. With each configuration, i will observe the thermal effects and the variations in SOC as i independently change the ambient temperature between 303k, 308k and 313k.
Simulink model:-
In this project, the requirement that we need to simulate the thermal effect and life cycle performance of lithium ion battery
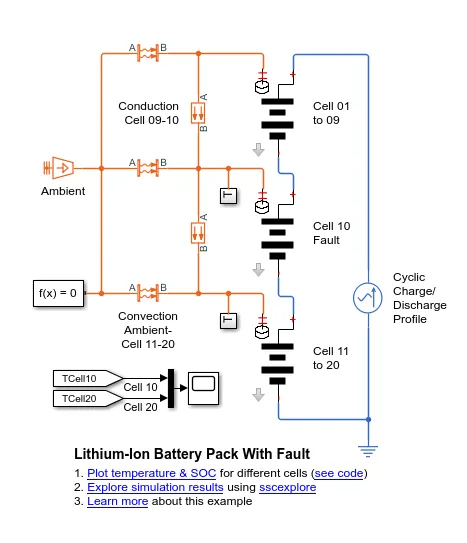
pack at various temperature , charge , discharge rate. Following are the model of lithium ion battery pack with fault :
In these model, the 3 battery pack connect in series. The first pack of battery contain cell 01 to cell 09 it means pack
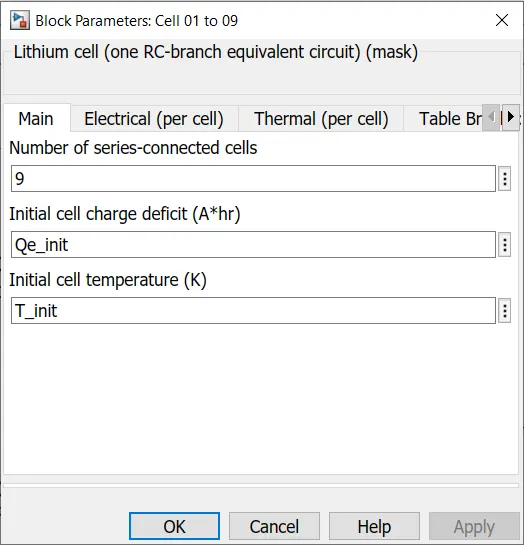
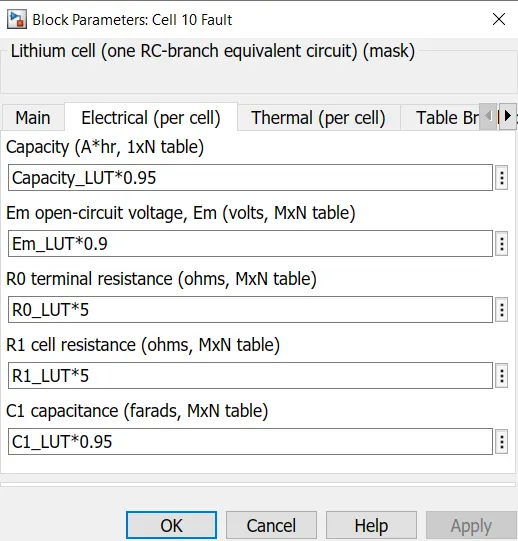
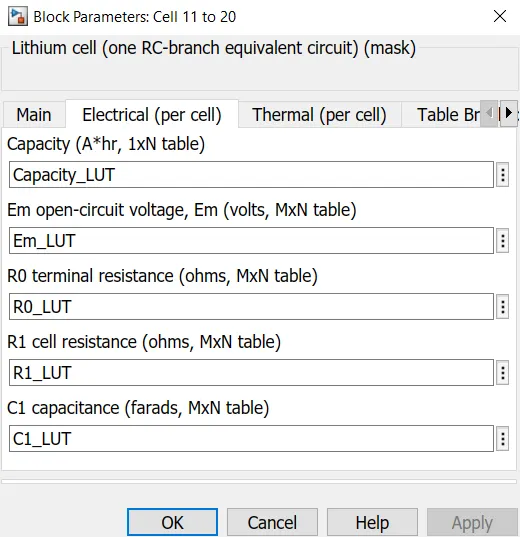
having 9 cell connect in series and third pack contain cell 11 to cell 20 it means it having 10 cell connect in series.The second pack contain cell 10 which is at fault condition bacause of thermal effect from system. the electrical parameter of first and third battery pack are set such as its capacity,open ckt voltage, cell resistance, capacitance shown in below :
1. AC Current Source:

The AC Current Source block represents an ideal current source that maintains the sinusoidal current through it,
independent of the voltage across its terminals.
The output current is defined by the following equation:
This block has two electrical conserving ports associated with its terminals.
2. Current Sensor:
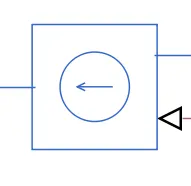
The Current Sensor block represents an ideal current sensor, that is, a device that converts current measured in
any electrical branch into a physical signal proportional to the current. Connections '+' and '–' are electrical conserving ports through which the sensor is inserted into the circuit. The connection 'I' is a
physical signal port that outputs the measurement result.
3. Lithium Cells:
The Lithium cell block represents an ideal lithium-ion cell used in a battery pack with thermal ports.
Connections '+' and '–' are electrical conserving ports through which the cells are inserted into the circuit. The Thermal port used for
further thermal network connections.
Here, the Cells pack 1-4 and 6-10 are normal and healthy cells, whereas Cell 5 is the faulty cell.
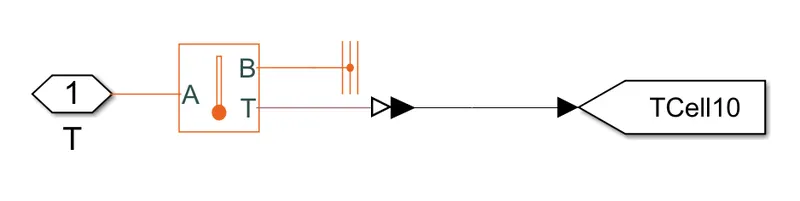
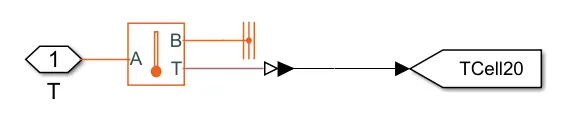
4. Temperature Sensor:


The Temperature Sensor block represents an ideal temperature sensor, that is, a device that determines the
temperature differential measured between two points without drawing any heat. Connections 'A' and 'B' are thermal conserving
ports that connect to the two points where the temperature is being monitored. Port 'T' is a physical signal port that outputs the
temperature differential value.
5. Conductive Heat Transfer:
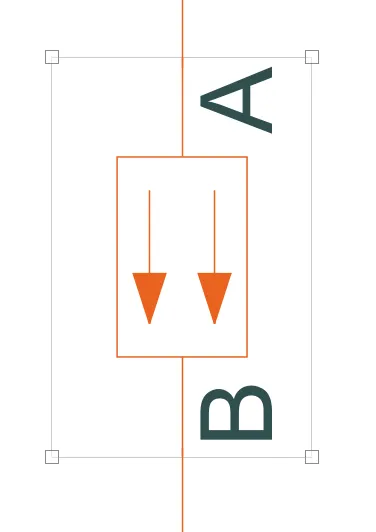
The Conductive heat transfer block models heat transfer in a thermal network by conduction through a
layer of material. The rate of heat transfer is governed by Fourier's law and is proportional to the temperature difference, material
thermal conductivity, area normal to the heat flow direction, and inversely proportional to the layer thickness.
6. Convective Heat Transfer:

The Convective heat transfer block models heat transfer in a thermal network by convection due to fluid
motion. The rate of heat transfer is proportional to the temperature difference, heat transfer coefficient, and surface area in contact
with the fluid.
7. Temperature Source:

The Temperature source block represents an ideal energy source in a thermal network that can maintain a
constant absolute temperature at the port regardless of the heat flow rate.
8. Rate Transition:
Rate Transition block transfers data from the output of a block operating at one rate to the input of another block
operating at a different rate. The Rate Transition block's parameters allow you to specify options that trade data integrity and
deterministic transfer for faster response and/or lower memory requirements.
9. Discrete-Time Integrator:
The Discrete-Time Integrator block implements discrete-time integration or accumulation of the input
signal. The block can integrate or accumulate using the Forward Euler, Backward Euler, and Trapezoidal methods.
10. Mux:

The Mux block combines inputs with the same data type and complexity into a vector output.
11. Electrical Reference, Thermal Reference, Solver Configuration, Scope, Display, Gain, Constant, Add, PS-Simulink Converter,
Simulink-PS Converter, Goto tag, and From are the miscellaneous blocks used in this model.
The three subsystems used in this model for the respective cells pack are as below

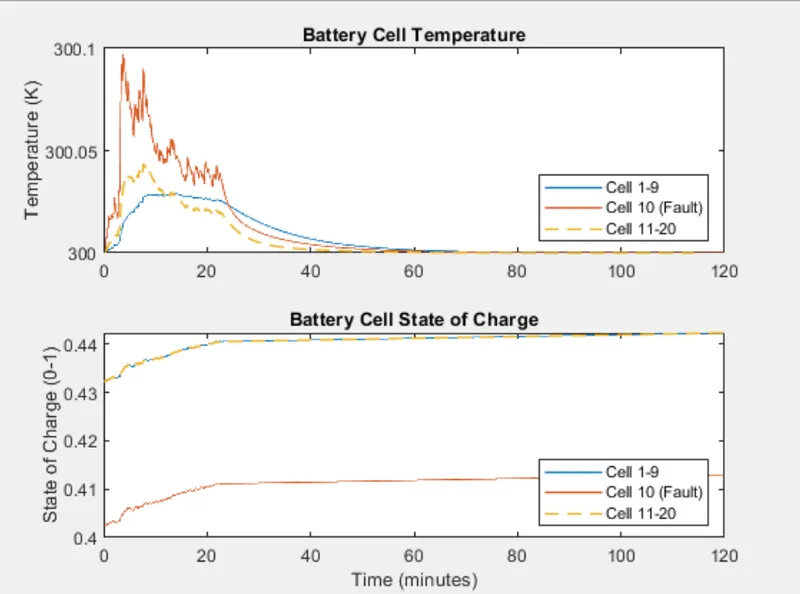
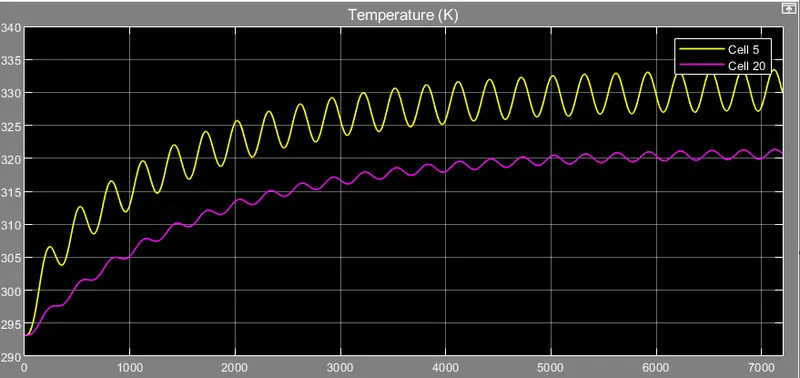
Result:- The result of the cyclic charge and discharge load on the battery pack are shown below:-
Temperature at 300K:-
From above temperature vs time graph, We can see that there is gradual increase in the temperature of three packs.
Initially the three pack start with same temperature at 300K. As we see the graph the second pack temperature after some seconds increases as compare to other first and third pack.The temperature of three pack increase in the fluctuating manner because of charging and discharging load. At 300 seconds :- The Third pack temperature is at 340 K and seconds pack at 392.5K. It means the temperature increase while the working battery pack. At 2000s :- The temperature of third pack about 365K and second pack is 435K. At 5000s:- the temperature of third pack is 365Kand temperature of second pack is 435K. In general increase in temperature of all three pack can be attribute to the continuous charging and discharging load. The second pak contain a fault cell,its temperature shoots up and remain at much higher level compare to other pack
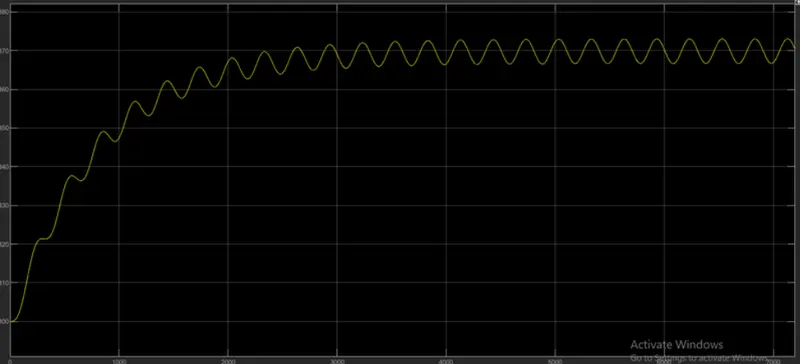
battery pack cell at 300 K:-
The temperature of first pack is start with 300 K. At 2000s:- the temperature of first pack is 369K these temperature is
higher than that of third pack because the first pack having more cell than the third pack.
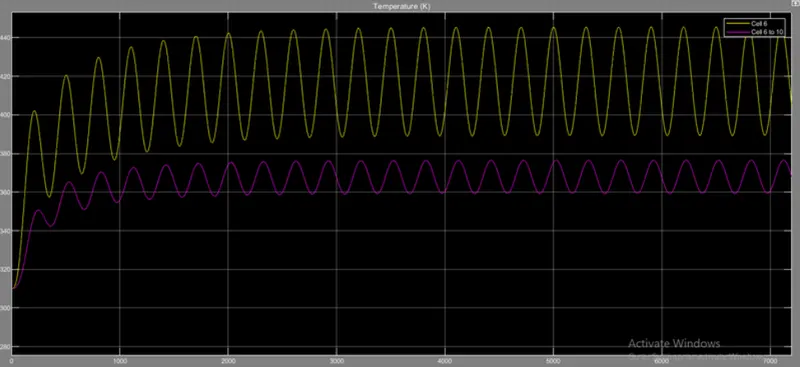
Temperature at 310 K:-
Drive cycle configuration:-
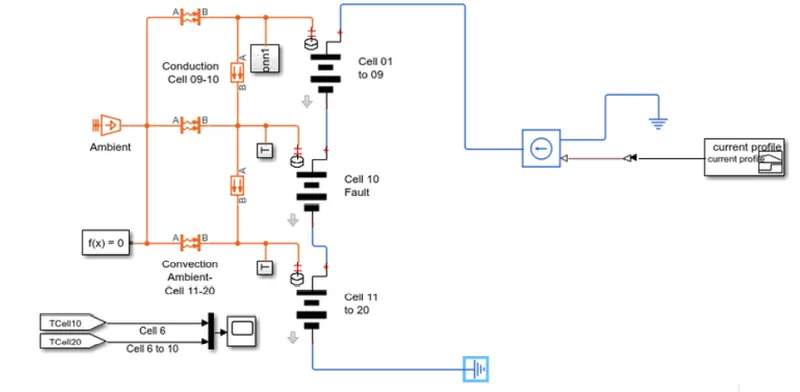
In this configuration, i remove the AC current block which provide cyclic charge /discharge load to battery pack .Now
instead of these i place the set of block for drie cycle load to applied battery pack.these block are as follows:-
1) Signal builder block
2) Controlled current source block
3) Simulink Ps converter block
4) Electrical reference block
In signal builder block contain the drive cycle with the current profile. These signal builder block connected to the controlled current
source through the simulink ps converter. The current signal is provide to the controlled current source and these source is connect to
battery pack terminal and another terminal of battery connect to the electrical reference. From these manner apply the load to
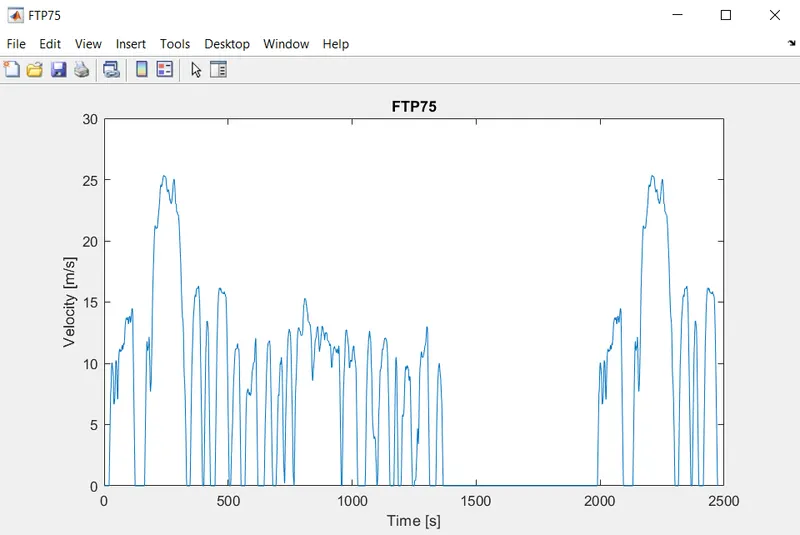
battery pack. The drive cycle plot image as shown below :-
Result:-
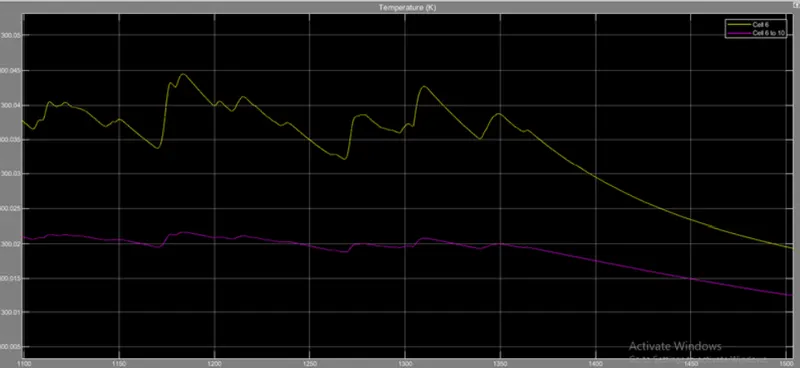
Temperature at 300K:-
Temperature at 315K:-
State of charge :-