Project 1 - Parsing NASA thermodynamic data
main coad
clear all
close all
clc
%Input
R=8.314; % Gas Constant
% Reading data file
% open file and reading THERMO.dat file
f1 = fopen('THERMO.dat','r')
get = fgetl(f1);
% Now Reading Temperature from this file
temp = fgetl(f1);
%spliting
s = strsplit(temp);
% converting strings cells into numbers
templow = str2num(s{2});
tempmid = str2num(s{3});
temphigh = str2num(s{4});
% Temperature Range
T = linspace(templow,temphigh,1000);
%Skipping comment lines
for i=1:3
get=fgetl(f1);
end
% Reading the Species
for j=1:53
tline=fgetl(f1);
A=strsplit(tline,' '); % spliting into cell array
species = (A{1}); % To read the name of the species
% Converting string to number
lowtemp = str2num(A{end-3});
midtemp = str2num(A{end-2});
hightemp = str2num(A{end-1});
tline1 = fgetl(f1); % getting next line
a = strfind(tline1,'E'); % Finding the string E
% Finding First 7 higher and second 7 lower coefficients
%Finding Higher coefficients
a1 = tline1(1:a(1)+3);
a1 = str2num(a1);
a2 = tline1(a(1)+4:a(2)+3);
a2 = str2num(a2);
a3 = tline1(a(2)+4:a(3)+3);
a3 = str2num(a3);
a4 = tline1(a(3)+4:a(4)+3);
a4 = str2num(a4);
a5 = tline1(a(4)+4:a(5)+3);
a5 = str2num(a5);
tline2 = fgetl(f1);
b = strfind(tline2,'E');
a6 = tline2(1:b(1)+3);
a6 = str2num(a6);
a7 = tline2(b(1)+4:b(2)+3);
a7 = str2num(a7);
% Finding Lower coefficients
a8 = tline2(b(2)+4:b(3)+3);
a8 = str2num(a8);
a9 = tline2(b(3)+4:b(4)+3);
a9 = str2num(a9);
a10 = tline2(b(4)+4:b(5)+3);
a10 = str2num(a10);
tline3 = fgetl(f1);
c = strfind(tline3,'E');
a11 = tline3(1:c(1)+3);
a11 = str2num(a11);
a12 = tline3(c(1)+4:c(2)+3);
a12 = str2num(a12);
a13 = tline3(c(2)+4:c(3)+3);
a13 = str2num(a13);
a14 = tline3(c(3)+4:c(4)+3);
a14 = str2num(a14);
% calculate specific heat
Cp = specific_heat(a1,a2,a3,a4,a5,a8,a9,a10,a11,a12,T,R,tempmid);
% calculate Entropy
S = entropy(a1,a2,a3,a4,a5,a7,a8,a9,a10,a11,a12,a14,T,R,tempmid);
% claculate Enthalpy
H = enthalpy(a1,a2,a3,a4,a5,a6,a8,a9,a10,a11,a12,a13,T,R,tempmid);
% Calculate Molecular weight of the Species
W = molecular_weight(species);
% writing molecular weight file
MW_file = fopen('Molecular Weight.txt','w');
fprintf(MW_file,'Molecular weight of %s is %d ',species,W);
fclose(MW_file); % Closing the file
%Plotting Cp, H and S with Temperature
% Saving in a folder
% changing directory
mkdir(species); %creating directory
cd(species);
% Plot 1 Cp vs T
figure(1)
plot(T,Cp,'linewidth',2,'color','b');
xlabel('Temperature(K)');
ylabel('Specific Heat(KJ)');
title(sprintf('Specific heat vs Temperature range of %s',species));
grid on
saveas(figure(1),'Specific Heat.jpg');
% Plot 2 S vs T
figure(2)
plot(T,S,'linewidth',2,'color','r');
xlabel('Temperature');
ylabel('Entropy(KJ/mol-K)');
title(sprintf('Entropy vs Temperature range of %s',species));
grid on
saveas(figure(2),'Entropy.jpg');
% Plot 3 Cp vs T
figure(3)
plot(T,H,'linewidth',2,'color','g');
xlabel('Temperature');
ylabel('Enthalpy(KJ/mol)');
title(sprintf('Enthalpy vs Temperature range of %s',species));
grid on
saveas(figure(3),'Enthalpy.jpg');
%Changing directory to Original matlab path
% Molecular weight
W = molecular_weight(species);
end
specific_heat coad
function Cp = specific_heat(a1,a2,a3,a4,a5,a8,a9,a10,a11,a12,T,R,tempmid)
% calculating specific heat
% calculating specific heat for higher and lower temperature repectively.
if (T <= tempmid)
Cp = R*(a8 + (a9*T) + (a10*(T).^2) + (a11*(T).^3) + (a12*(T).^4));
else
Cp = R*(a1 + (a2*T) + (a3*(T).^2) + (a4*(T).^3) + (a5*(T).^4));
end
end
plot result for specific heat o2,n2,co2
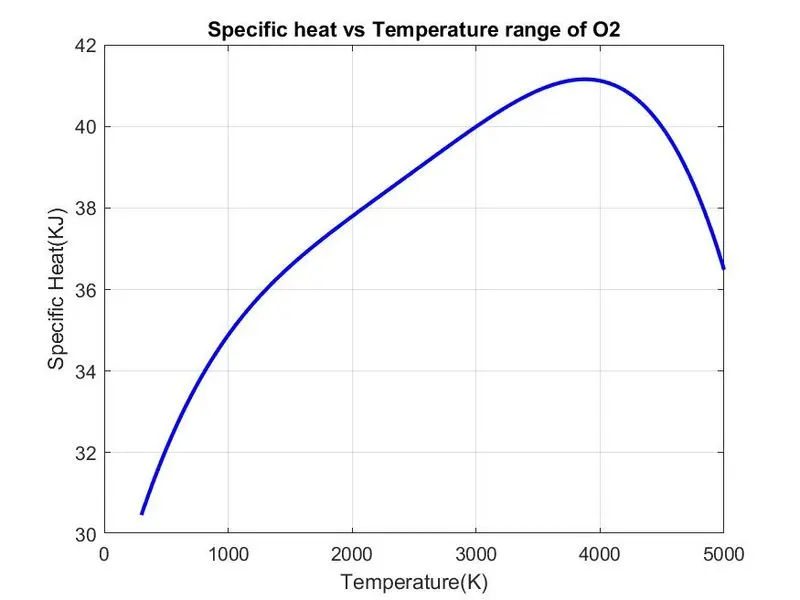
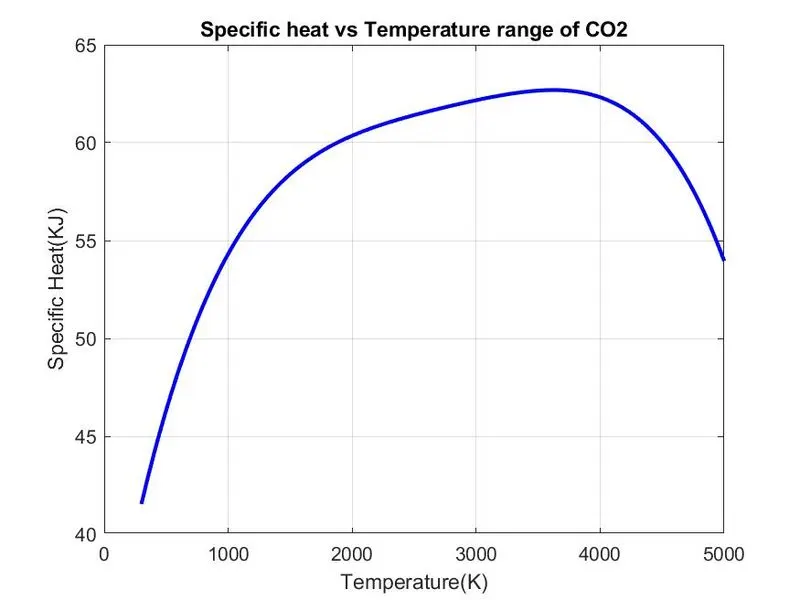
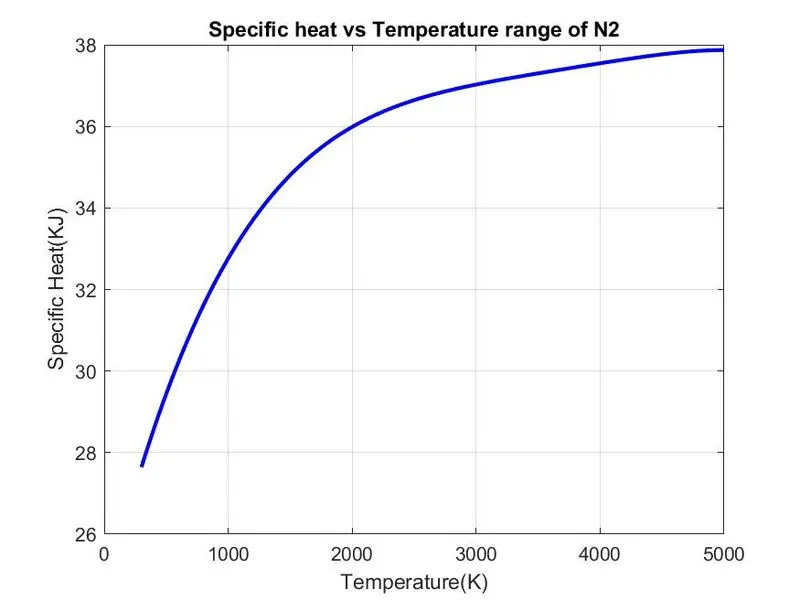
s
entropy coad
function S = entropy(a1,a2,a3,a4,a5,a7,a8,a9,a10,a11,a12,a14,T,R,tempmid)
% calculating entropy
% calculating entropy for higher and lower temperature repectively.
if (T <= tempmid)
S = R*(a8.*log(T) + (a9*T) + ((a10*(T).^2)/2) + ((a11*(T).^3)/3) + ((a12*(T).^4)/4) + a14);
else
S = R*(a1.*log(T) + (a2*T) + ((a3*(T).^2)/2) + ((a4*(T).^3)/3) + ((a5*(T).^4)/4) + a7);
end
end
plot result for Entropy o2,n2,co2
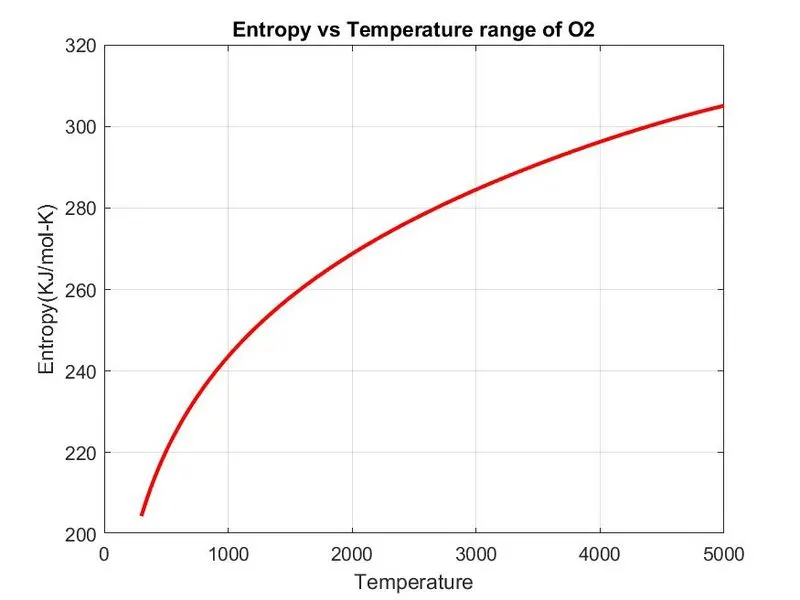
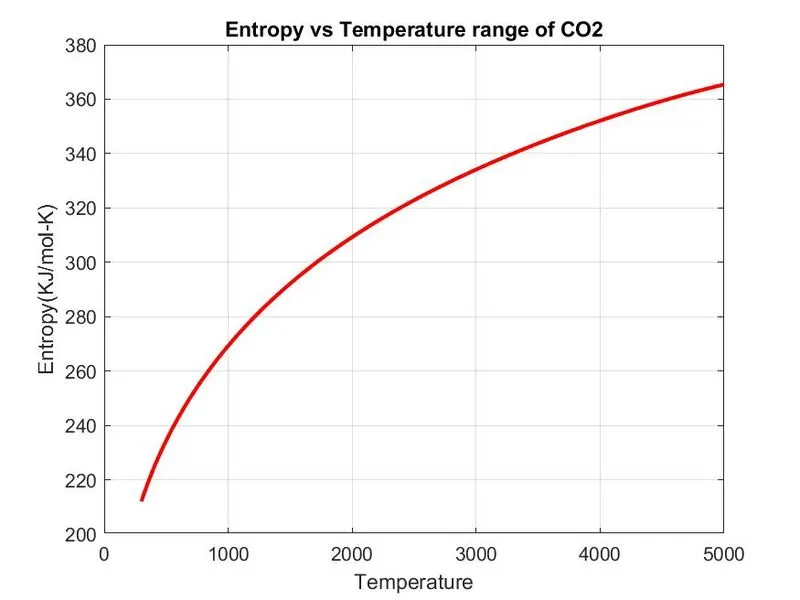
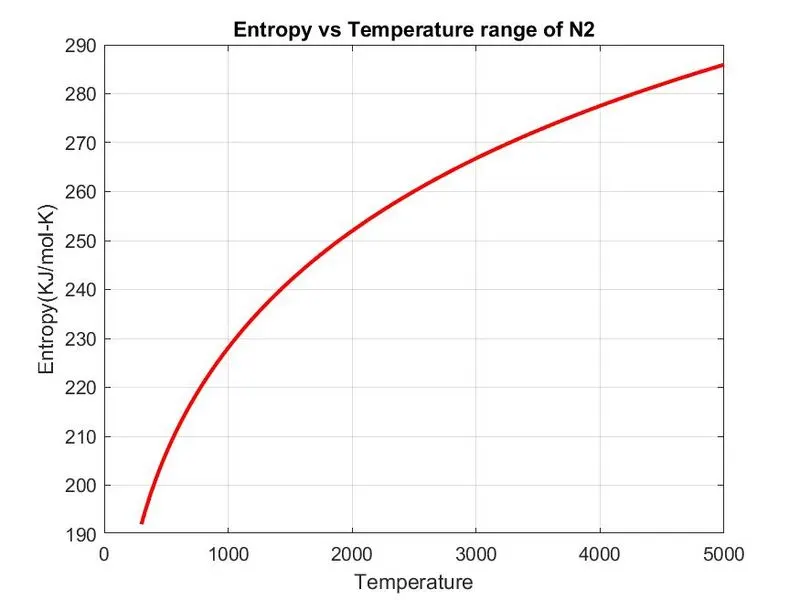
enthalpy
function H = enthalpy(a1,a2,a3,a4,a5,a6,a8,a9,a10,a11,a12,a13,T,R,tempmid)
% calculating enthalpy
% calculating enthalpy for higher and lower temperature repectively.
if (T <= tempmid)
H = R*T.*(a8 + ((a9*T)/2) + ((a10*(T).^2)/3) + ((a11*(T).^3)/4) + ((a12*(T).^4)/5)+ ((a13./T)));
else
H = R*T.*(a1 + ((a2*T)/2) + ((a3*(T).^2)/3) + ((a4*(T).^3)/4) + ((a5*(T).^4)/5) + ((a6./T)));
end
end
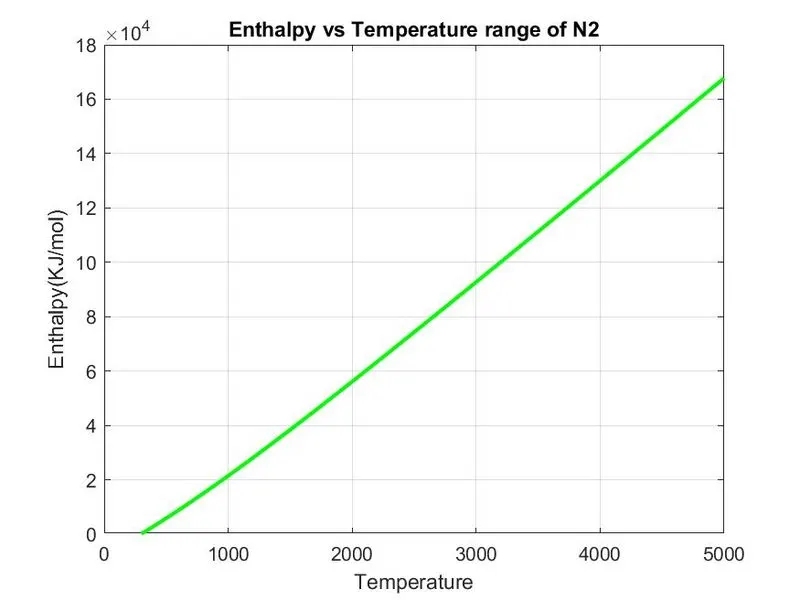
plot result for enthalpy o2,n2,co2
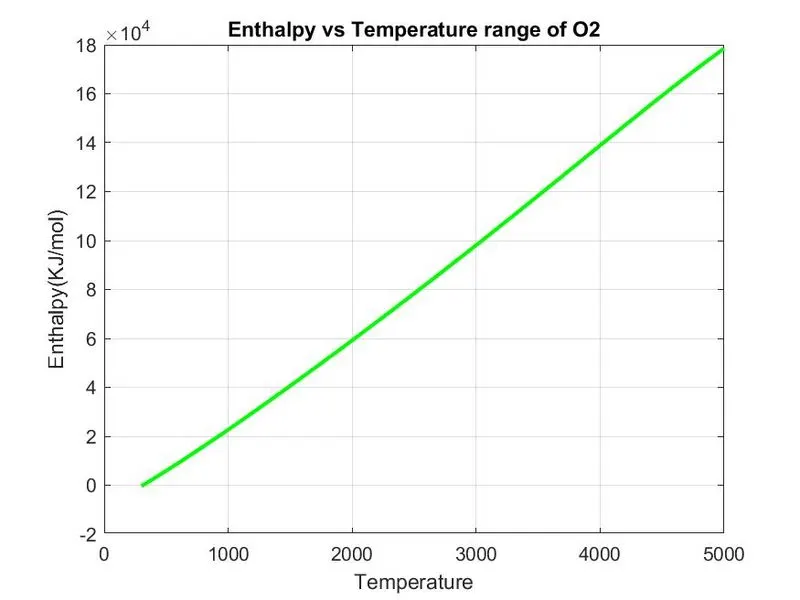
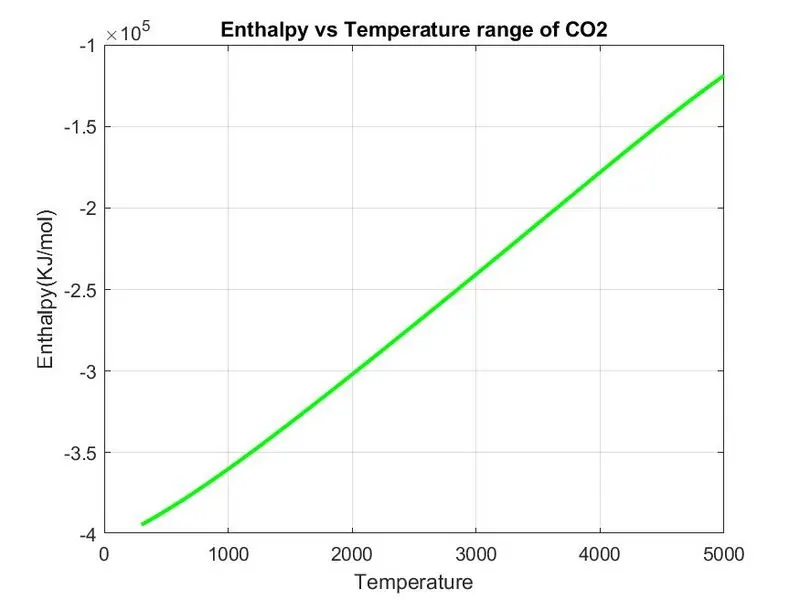
Molecular Weightcoad
function W = molecular_weight(species)
% Defining Atomic name of the species
atomic_name = ['H','C','O','N','Ar'];
% Defining Atomic masses of main species
atomic_weight = [1.008 12.011 15.999 14.007 39.948];
W=0; % Molecular weight starting range
for i=1:length(species) % Loop runs to the length of the species
for j=1:length(atomic_name) % Loop runs to the length of the atomic names
if strcmp(species(i), atomic_name(j)) %function to compare 2 strings
W = W + atomic_weight(j);
position = j;
end
end
n = str2num(species); % Now we will find if there is more element in the species then incrementingatomic weight of the species
if n>1
W = W + atomic_weight(position)*(n-1);
end
end
fprintf('Molecular Weight of %s :- ',species);
fprintf('%f',W);
disp(' ')
end
Screenshots