Project 2 Thermal modeling of battery pack
Aim: For a 10 cell series lithium ion battery model, simulate the thermal effects and compare life cycle performance at various temperatures, charge & discharge rates using MATLAB.
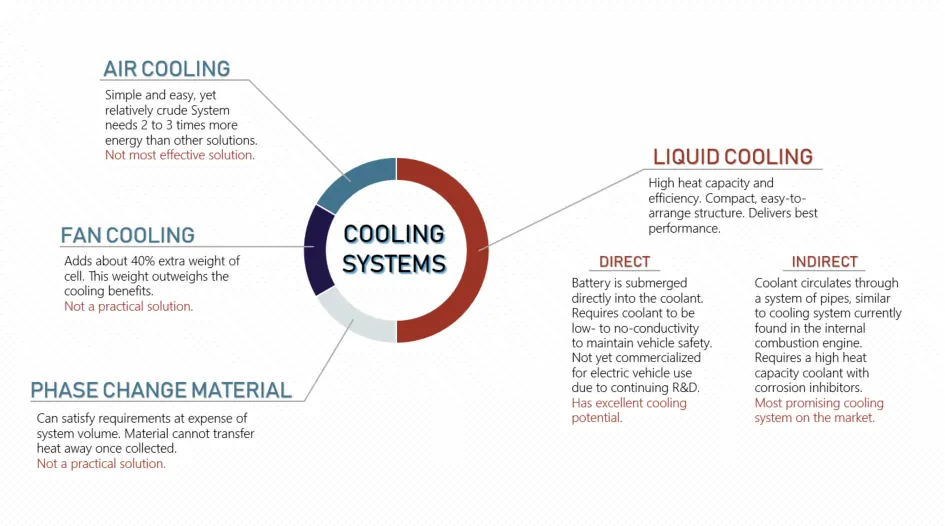
Theory: The lithium ion battery are the most commonly used battery in different hybrid and electric vehicle. We also know that the operational performance of this types of battery mainly depends on the operating temperature of the battery, So it become more important to control the battery temperature with a proper cooling system.Four different cooling systems:
- Phase Change Material (PCM)
- Fin Cooling
- Air Cooling
- Liquid Cooling (both Direct and Indirect)
-
Phase change material absorbs heat energy by changing state from solid to liquid. While changing phase, the material can absorb large amounts of heat with little change in temperature. Phase change material cooling systems can meet the cooling requirements of the battery pack, however, the volume change that occurs during a phase change restricts its application. Also, phase change material can only absorb heat generated, not transfer it away, which means that it won’t be able to reduce overall temperature as well as other systems. Although not favorable for use in vehicles, phase change materials can be useful for improving thermal performance in building by reducing internal temperature fluctuations and reducing peak cooling loads.
-
Cooling fins increase surface area to increase the rate of heat transfer. Heat is transferred from the battery pack to the fin through conduction, and from the fin to the air through convection. Fins have high thermal conductivity and can achieve cooling goals, but they add a lot of additional weight to the pack. The use of fins has found a lot of success in electronics, and traditionally they have been used as an additional cooling system on internal combustion engine vehicles. Using fins to cool the electric car battery has fallen out of favor since the additional weight of the fins outweighs the cooling benefits.
-
Air cooling uses the principle of convection to transfer heat away from the battery pack. As air runs over the surface, it will carry away the heat emitted by the pack. Air cooling is simple and easy, but not very efficient and relatively crude compared to liquid cooling. Air cooling is used in earlier versions of electric cars, such as the Nissan leaf. As electric cars are now being used more commonly, safety issues have arisen with purely air-cooled battery packs, particularly in hot climates. Other car manufacturers, such as Tesla, insist that liquid cooling is the safest method.
-
Liquid coolants have higher heat conductivity and heat capacity (ability to store heat in the form of energy in its bonds) than air, and therefore performs very effectively and own advantages like compact structure and ease of arrangement. Out of these options, liquid coolants will deliver the best performance for maintaining a battery pack in the correct temperature range and uniformity. Liquid cooling systems have their own share of safety issues related to leaking and disposal, as glycol can be dangerous for the environment if handled improperly. These systems are currently used by Tesla, Jaguar, and BMW, to name a few.
The working temperature of the lithium ion cell is important because it influence the performance, efficiency, safety and capacity and by the charging and discharging itself. Hence thermal model of battery are made to calculate and estimate the cell temperature for safe use of the battery pack.
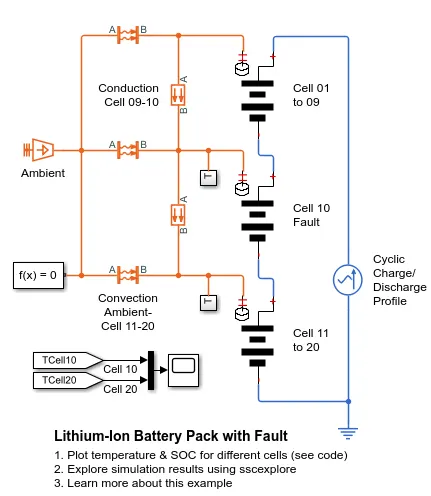
For this we have a default matlab model made with name ' Lithium ion battery pack with fault '. which shows 20 cell in series with one of the cell as faulty to check the temperature variation overall performance of the battery pack. To make a cell faulty its capacity is reduced. The default model is shown below:
In the above model we have made some changes and simulated it to get the desired output. The revised model is shown below:
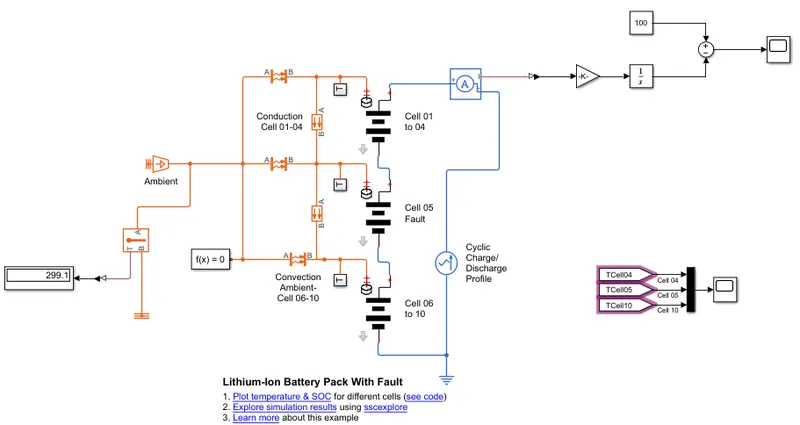
In this above model 10 cells are connected in series to find thermal effect and life cycle performance related to temperature, charging and discharging and also conduction and convection blocks are used to show how heat transfer takes place in battery pack.
The 10 cells are connected as a combination of three packs i.e. first pack consist of 4 number of cells in series the second pack has only one cell which is faulty. The last pack has 5 cells in total connected in series.
The heat transfer is observed in the pack through conduction and convection block which are mode of heat transfer.
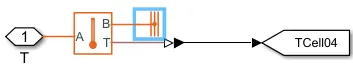
T subsystem is connected at every battery pack to plot the temperature graph for each battery pack.
A external ambient temperature source is present along with temperature sensor to display the ambient temperature
The battery pack is connected to AC current source to observe cyclic charging and discharging rate graph.
A current sensor is added to sence the SOC of the battery pack. and all the other result are their is simscape result menu.
Cell 01 to 04 subsystem:
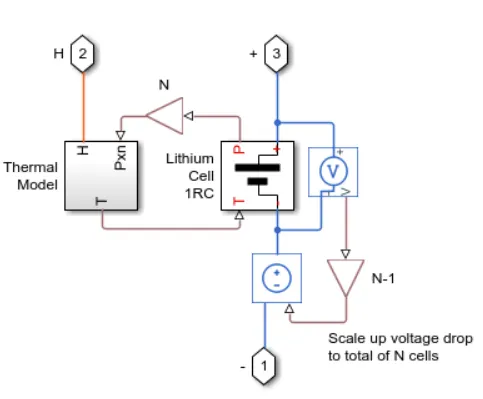
Cell subsystem consist of thermal model and lithium cell 1RC block which calculate the temperature and thermal effect of cells and overall calculation of battery pack.
1RC Subsystem:
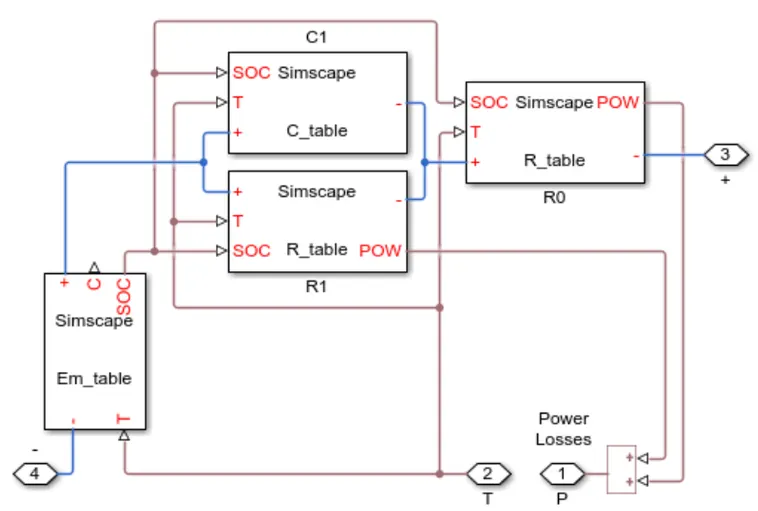
This block basically consist of capacitance value which depends on external physical signal input SOC and T. It is assumed that the capacitancevalue is slowly varing with time, hence the equation 1 = c*dv/dt holds.
Resistance value table which depands on an external physical signal input i.e. SOC and T.
Voltage value which implements the cell main branch voltage source and determine values of capacity and SOC. The defining equation depends on cell temperature.
Blocks used in the above model is explained and configured below:
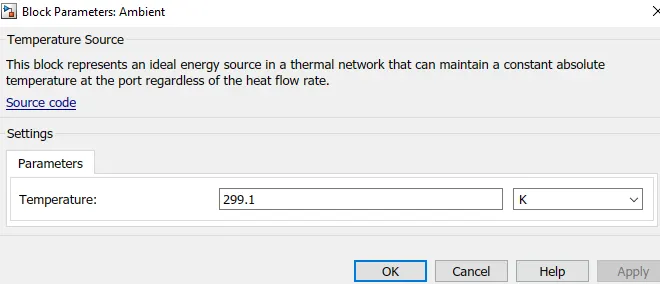
1. Ambient Temperature Source: The Temperature Source block represents an ideal source of thermal energy that is powerful enough to maintain specified temperature at its outlet regardless of the heat flow consumed by the system.

On double clicking on the block configuration block will open where we can enter the temperature that we need to maintain. The configuration block is shown below:
2. Temperature Sensor: The Temperature Sensor block represents an ideal temperature sensor, that is, a device that determines the temperature differential measured between two points without drawing any heat.
Connections A and B are thermal conserving ports that connect to the two points where temperature is being monitored. Port T is a physical signal port that outputs the temperature differential value.
The block positive direction is from port A to port B. The measured temperature is determined as T = TA – TB

3. Thermal reference: The Thermal Reference block represents a thermal reference point, that is, a point with an absolute zero temperature, with respect to which all the temperatures in the system are determined.

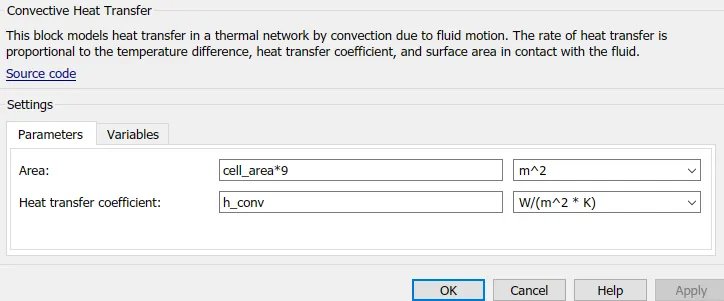
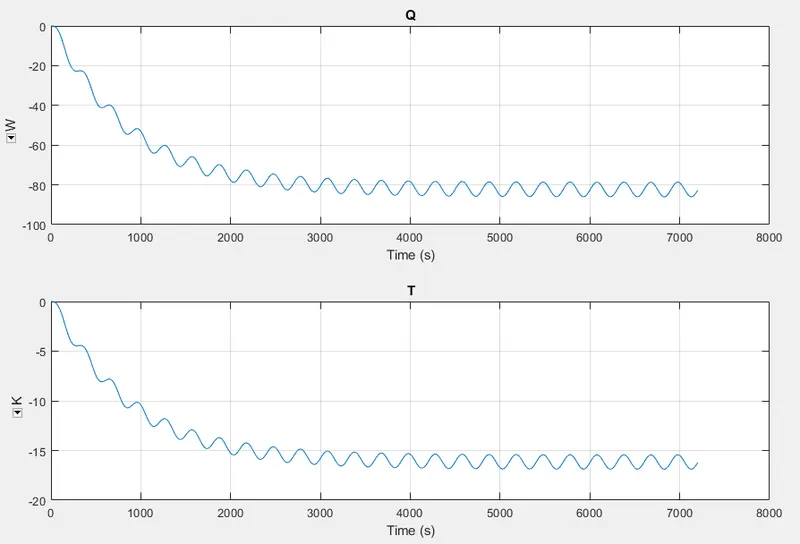
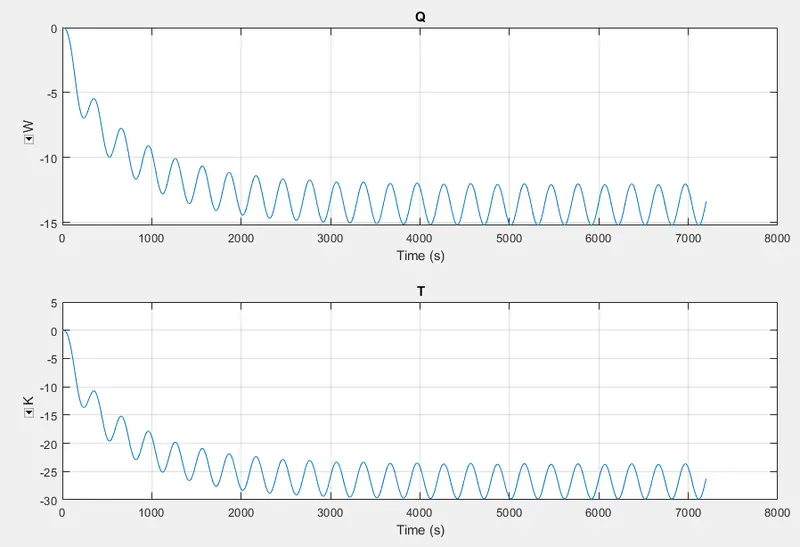
4. Convective Heat Transfer: The Convective Heat Transfer block represents a heat transfer by convection between two bodies by means of fluid motion. The transfer is governed by the Newton law of cooling:
Q=k⋅A⋅(TA−TB),
where:
-
Q is heat flow.
-
k is convection heat transfer coefficient.
-
A is surface area.
-
D is distance between layers (that is, thickness of material).
-
TA and TB are temperatures of the two bodies.

On double clicking on the block configuration block will open. which is shown below:
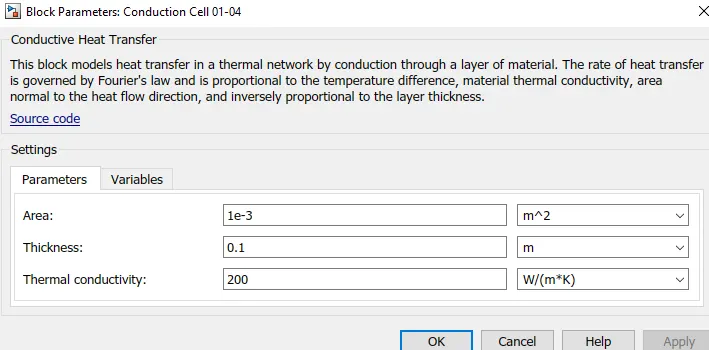
5. Conductive Heat Transfer: The Conductive Heat Transfer block represents a heat transfer by conduction between two layers of the same material. The transfer is governed by the Fourier law:
Q=k⋅AD(TA−TB),
where:
-
Q is heat flow.
-
k is thermal conductivity of the material.
-
A is area normal to the heat flow direction.
-
D is distance between layers (that is, thickness of material).
-
TA is temperature of layer A.
-
TB is temperature of layer B.

On double clicking on the block configuration block will open. which is shown below:
6. T Subsystem: It is a subsystem which has a model to make the graph temperature of each battery pack. The subsystem is shown below:
7. Cell 01 to 04: Here we have 4 cells which are connected in series and all this cells are perfect cells. The cell 01 to 04 subsystem is shown below:
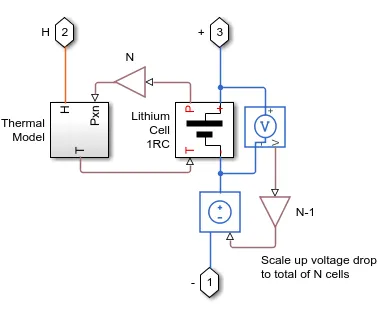
On double clicking on cell 01 to 04 we get configuration block as shown below:
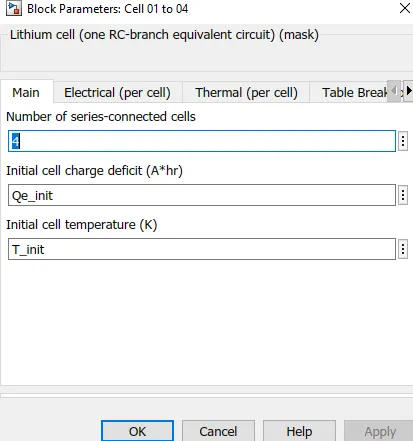
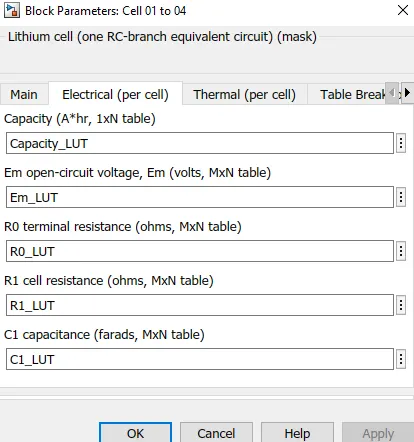
8. Cell 05: Here we have only one cell which is faulty cell. The subsystem is same for all the cells lets see the configuration parameters of this cell.
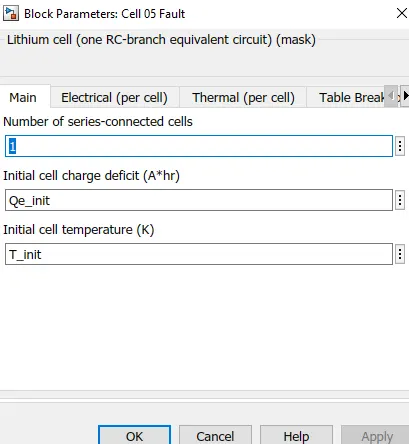
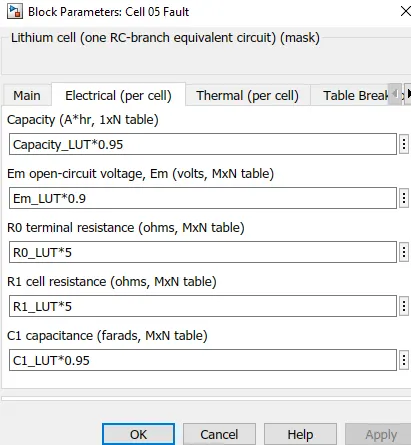
Here to make this cell as faulty we have reduced the capacity, open circuit voltage and capacitance. Also we increase the terminal resistance and cell resistance by a factor of 5 to make it faulty.
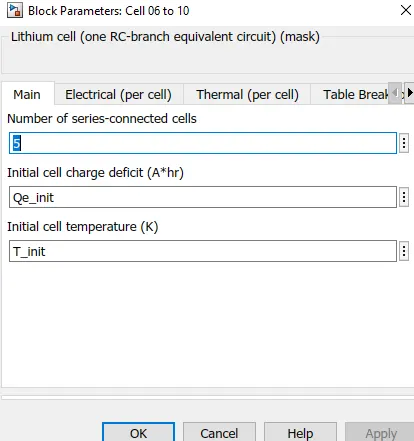
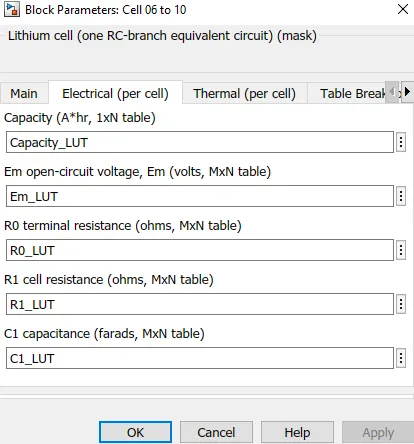
9. Cell 06 to 10: Here we have 5 cells which are connected in series and all this cells are perfect cells.lets see the configuration parameters of this cell.
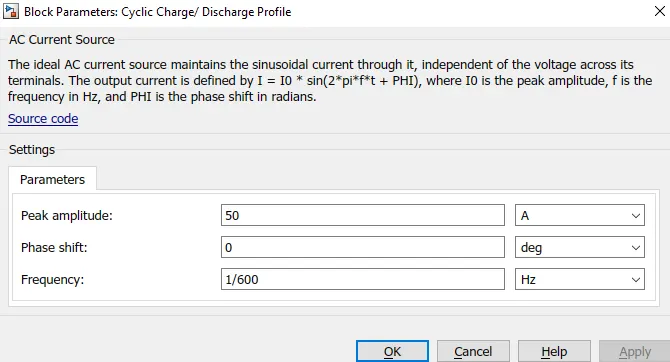
10. Cyclic charging discharging profile: The ideal AC current source maintains the sinusoidal current through it, independent of the voltage across its terminals. The output current is defined by I = I0 * sin(2*pi*f*t + PHI), where I0 is the peak amplitude, f is the frequency in Hz, and PHI is the phase shift in radians.
on double clicking we see the configuration parameters of the block asshown below:
11. Current sensor: The Current Sensor block represents an ideal current sensor, that is, a device that converts current measured in any electrical branch into a physical signal proportional to the current.Use the + and - ports to connect the sensor in series with the other blocks in the branch where you want to measure the current. Port I outputs the measurement result as a physical signal.
12. Model to calculate SOC: Here we take current as an input then passing it through gain and integrator block to get SOC.
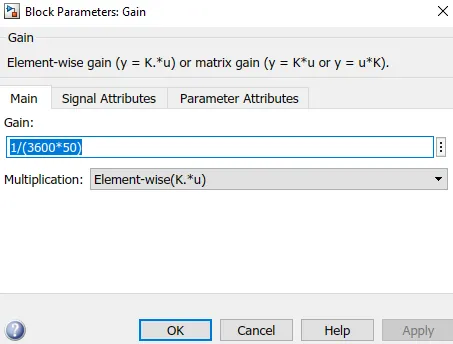
The coulomb counting method measures the discharging current of the battery and integrates the discharge current over time in orfer to estimate SOC.
This subsystem takes current as input and gives the battery SOC as output. The current sensor block is used and connected for SOC estimation.
Results: Here we conduct five different types of test which changes the temperature of the ambient and all three battery pack.
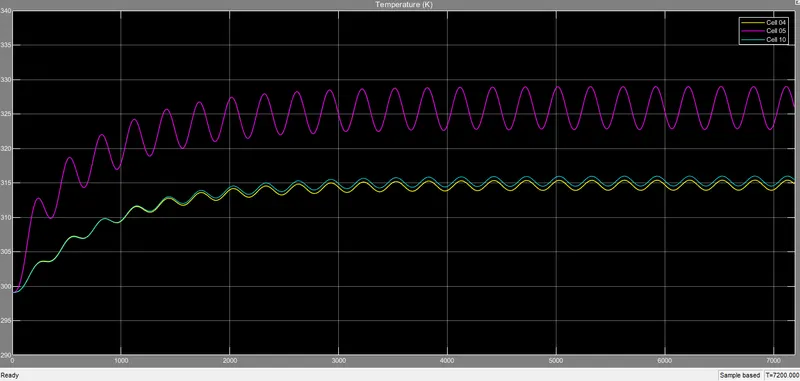
Test 1: Ambient temperature = 299.1 K , All cell temperatureis set at 299.1 K. For Cells to set the temperature we double click on the cell we get configuration parameters and at bottom we see initial cell temperature there we can change the temperature of cells.
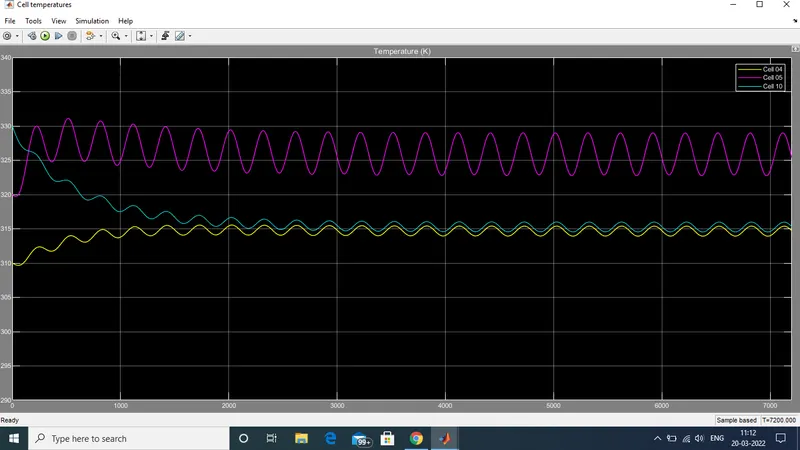
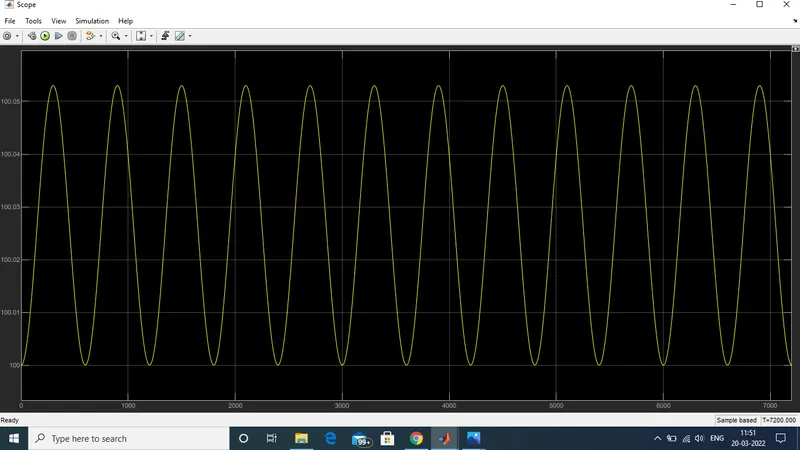
Temperature Graph: Here all the three battery pack start with same initial temperature. but as we start the simulation the cell no 5 will suddenly rise in temperature due to fault in that cell. cell 04 and cell 10 will be same have same temperature for some time but after that cell 10 will have rise in temperature because of more number of cells in its pack.
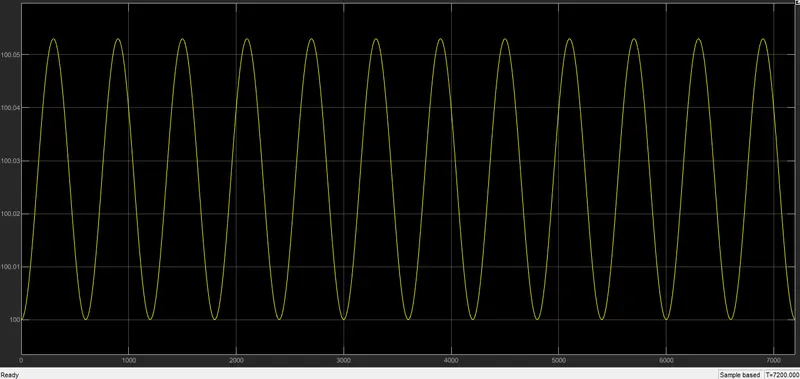
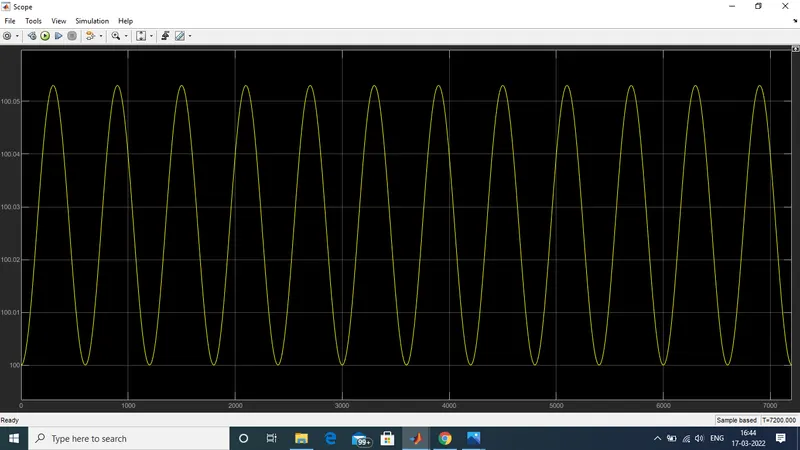
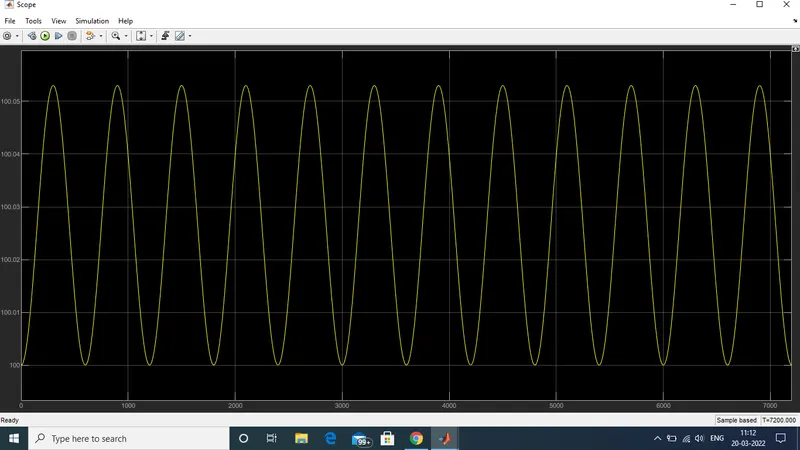
SOC: The SOC graph shows the contineous charging and discharging from 0% to 53%. The same is shown in the graph below:
Conduction:
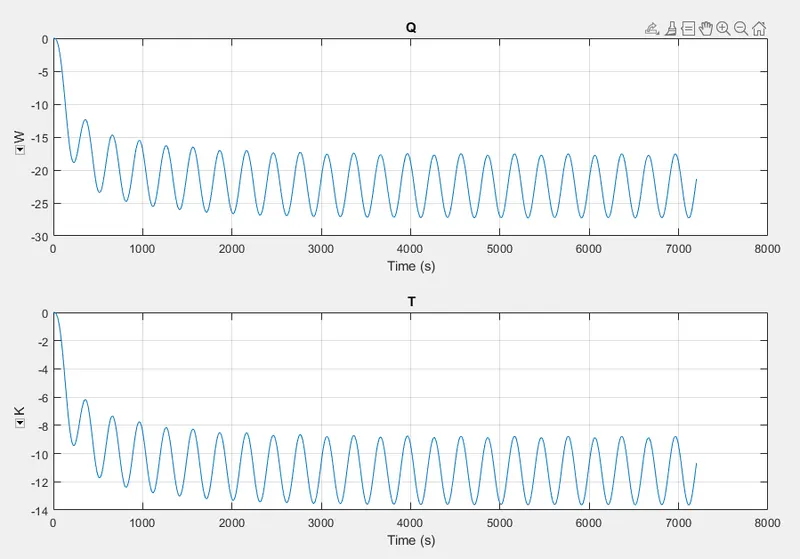
For cell 04 to 05:
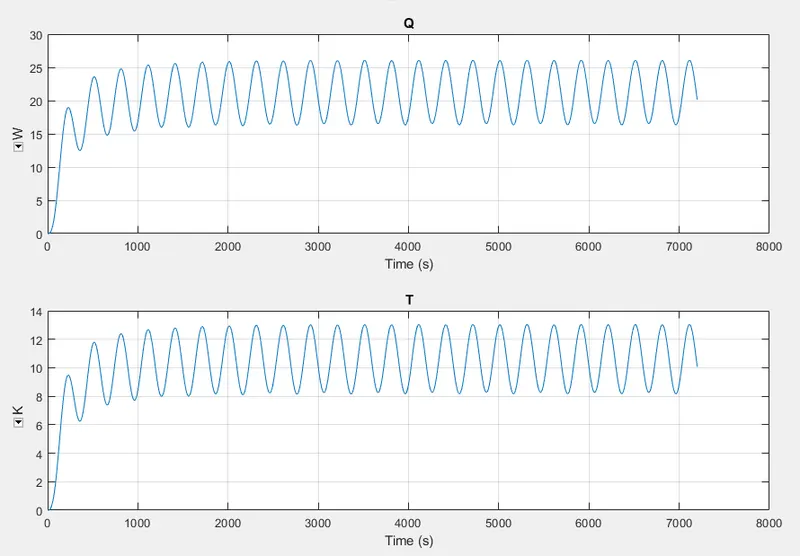
For cell 06 to 10:
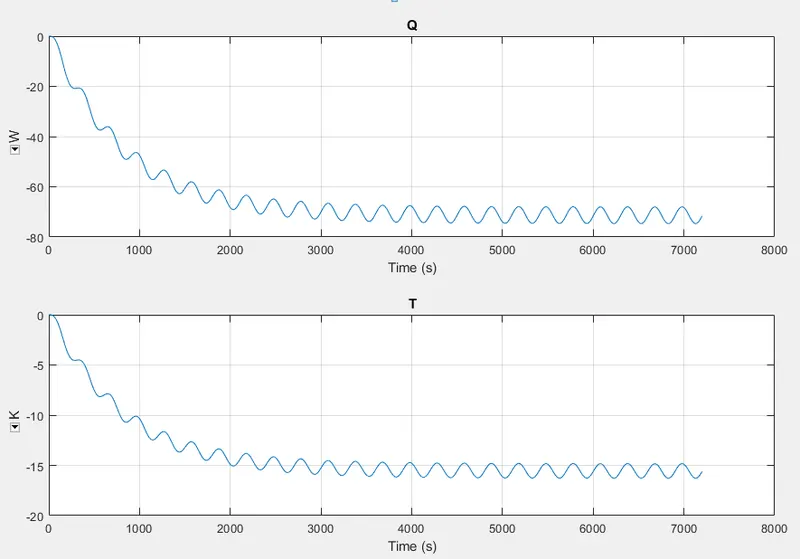
Convection:
Cell 01 to 04:
Cell 05:
Cell 06 to 10:
Test 2: Ambient temperature = 299.1 K , Cell from 01 to 04 is set to 310K , Cell 05 is set at 299.1K , Cell 06 to 10 set to 310K. For Cells to set the temperature we double click on the cell we get configuration parameters and at bottom we see initial cell temperature there we can change the temperature of cells.
Temperature Graph: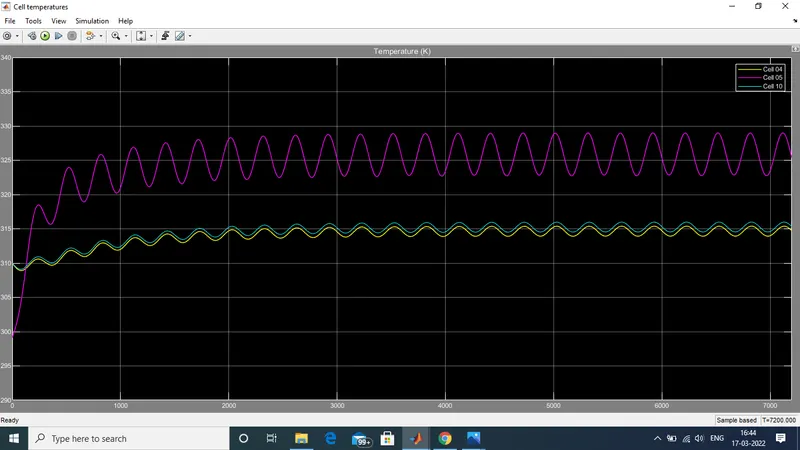 SOC:
SOC:
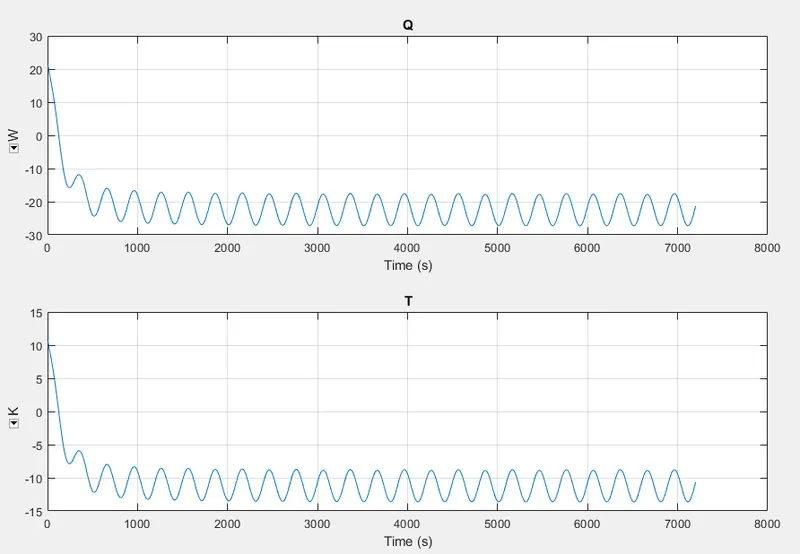
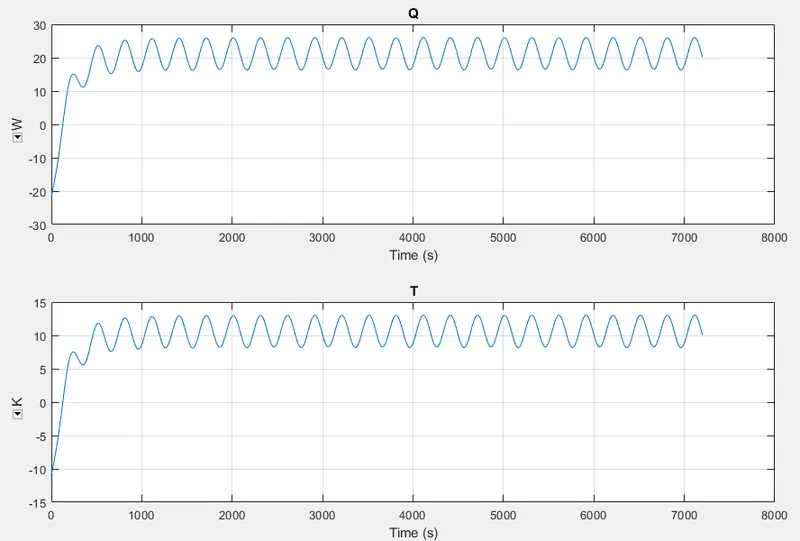
 Conduction:
For cell 04 to 05:
For cell 06 to 10:
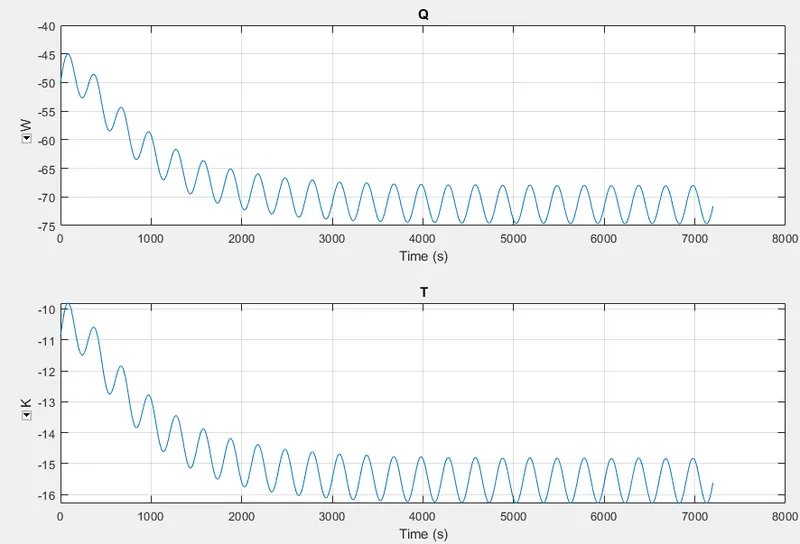
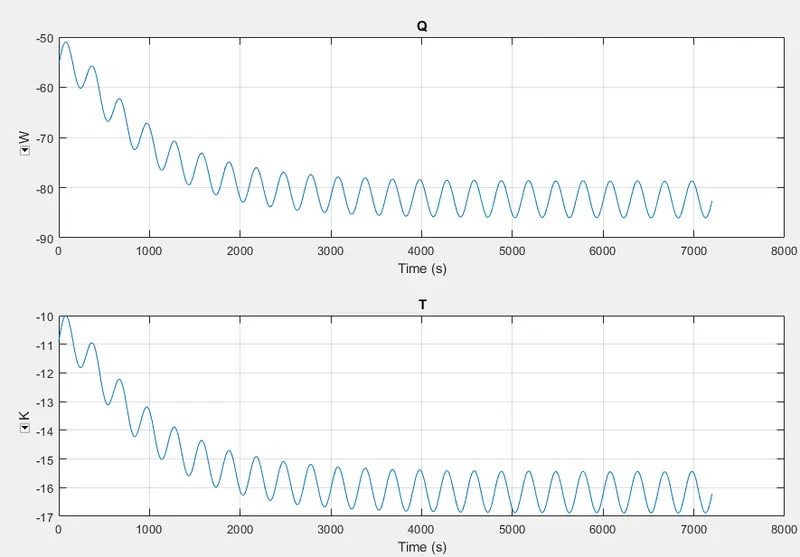
Convection:
Cell 01 to 04:
Cell number 5:
Cell 06 to 10:
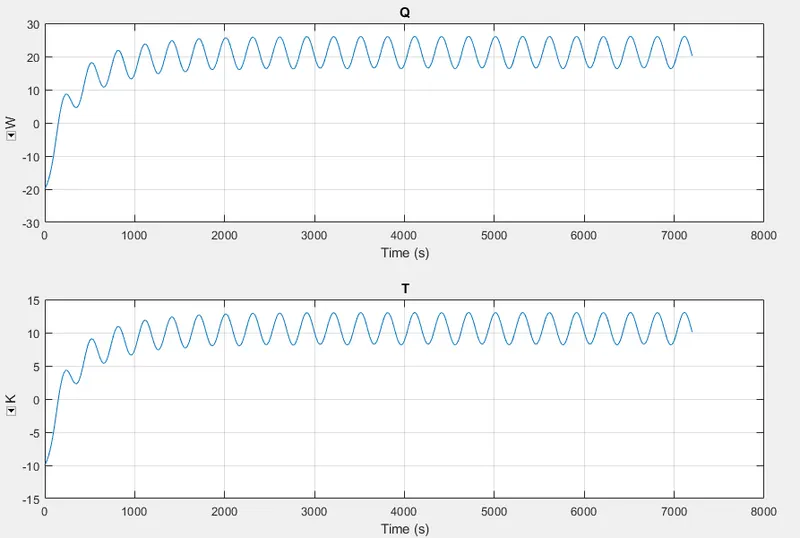
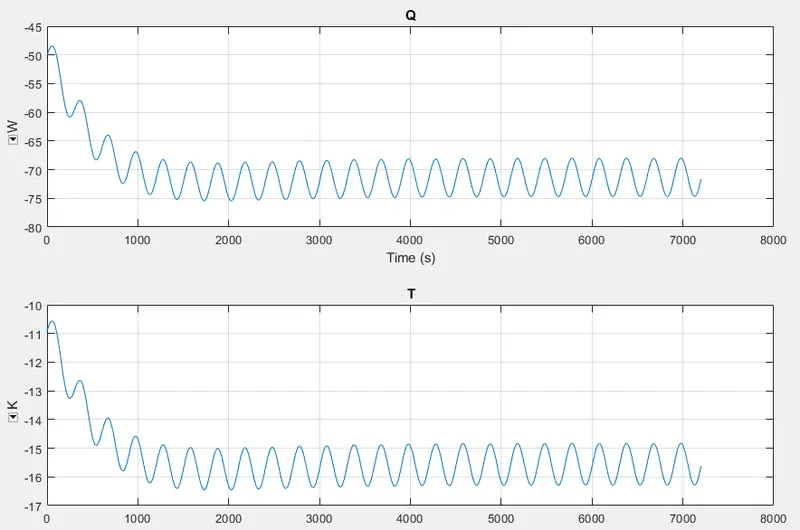
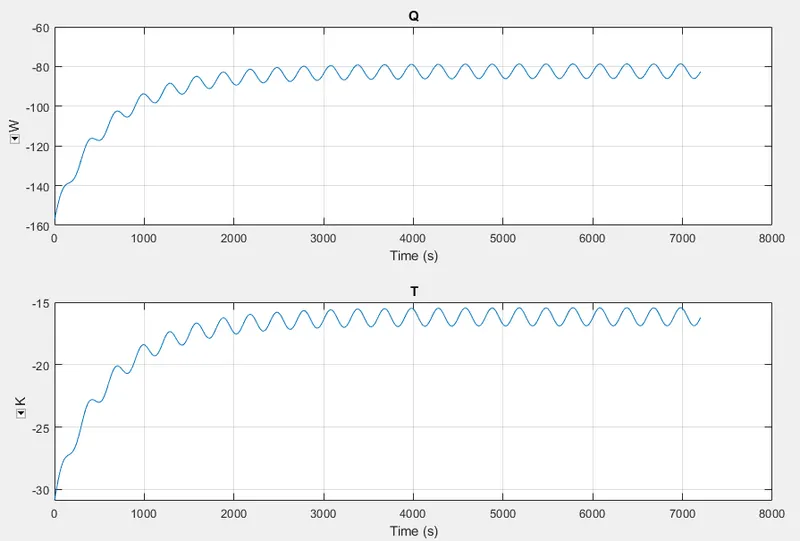
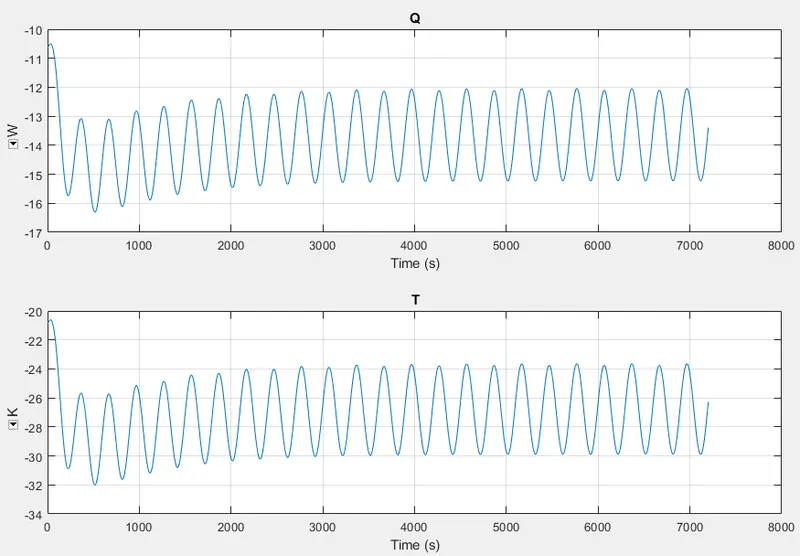
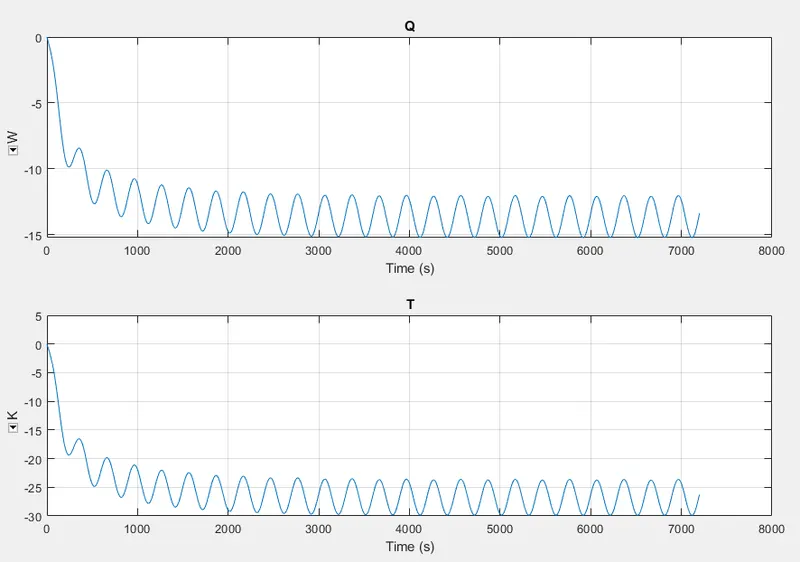 Test 3: Ambient temperature = 299.1 K , Cell from 01 to 04 is set to 310K , Cell 05 is set at 320K , Cell 06 to 10 set to 330K. For Cells to set the temperature we double click on the cell we get configuration parameters and at bottom we see initial cell temperature there we can change the temperature of cells.
Temperature Graph:
SOC:
Conduction:
From cell 04 to 05:
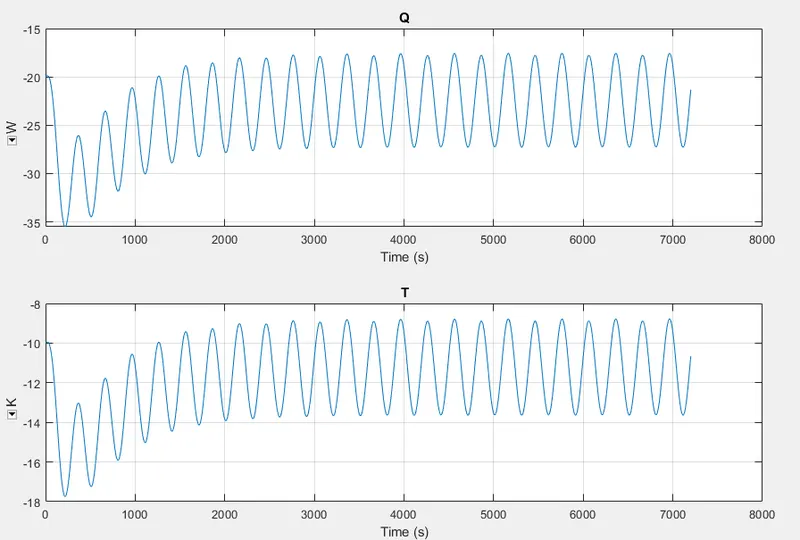
From cell 10 to 11:
Convection:
For cell 01 to 04:
For cell 05:
For cell 06 to 10:
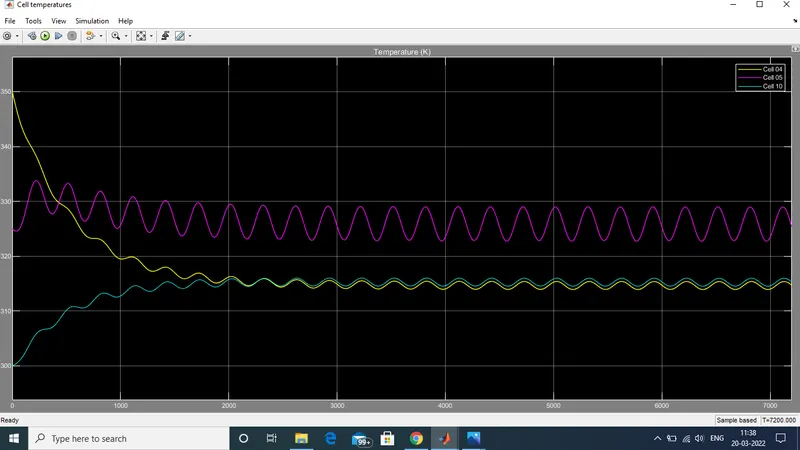
Test 4: Ambient temperature = 299.1 K , Cell from 01 to 04 is set to 350K , Cell 05 is set at 325K , Cell 06 to 10 set to 300K. For Cells to set the temperature we double click on the cell we get configuration parameters and at bottom we see initial cell temperature there we can change the temperature of cells.
Temperature graph:
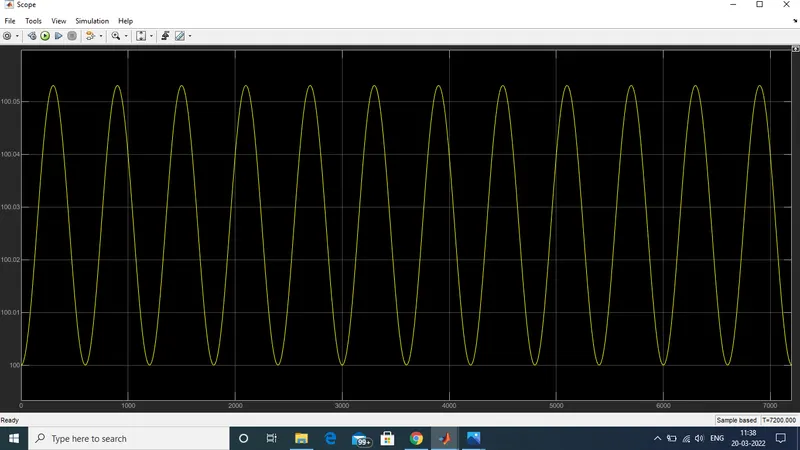
SOC:
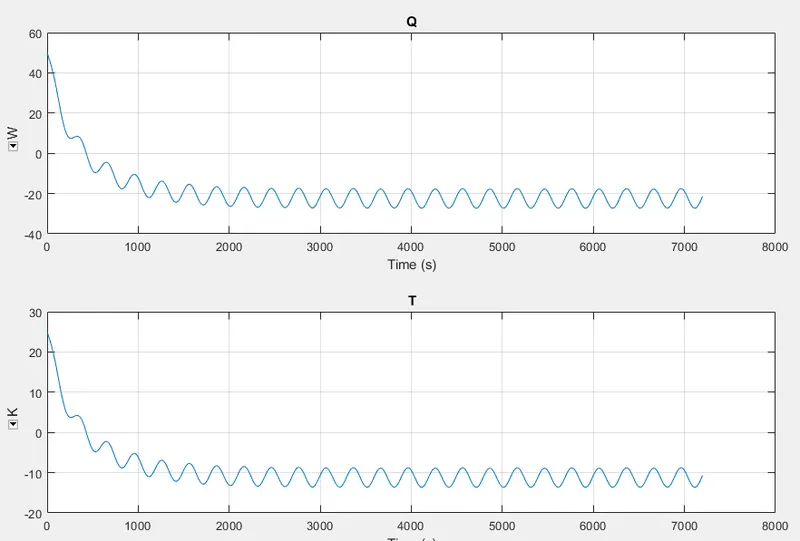
Condection:
For cell 04 to 05:
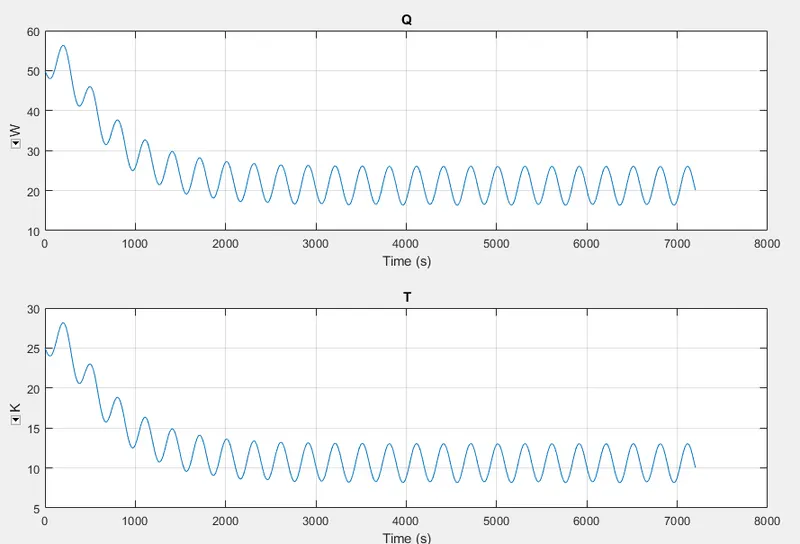
For cell 10 to 11:
convection:
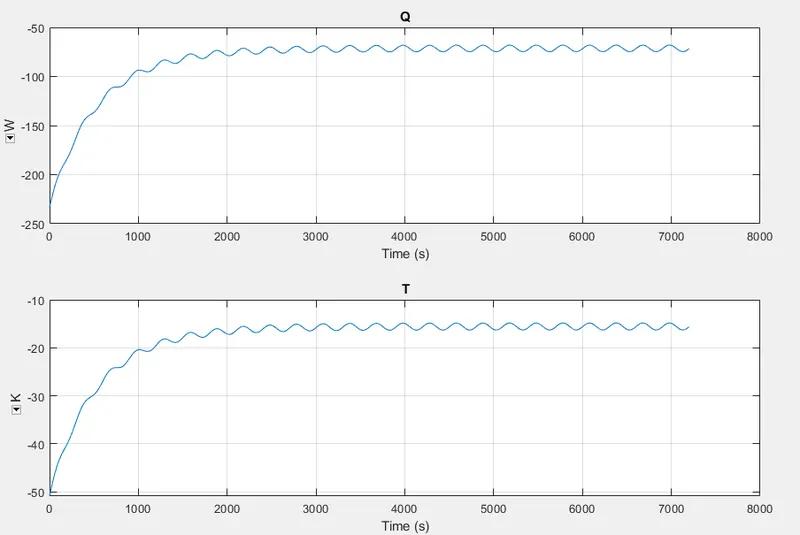
For cell 01 to 04:
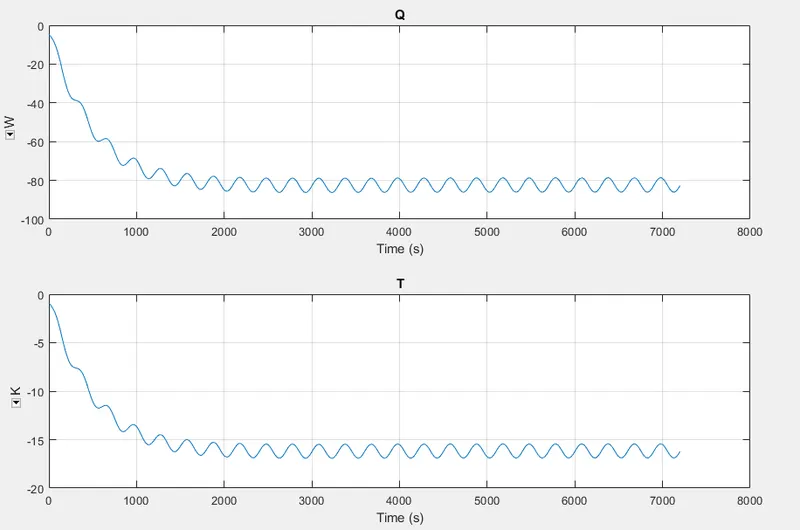
For cell 05:
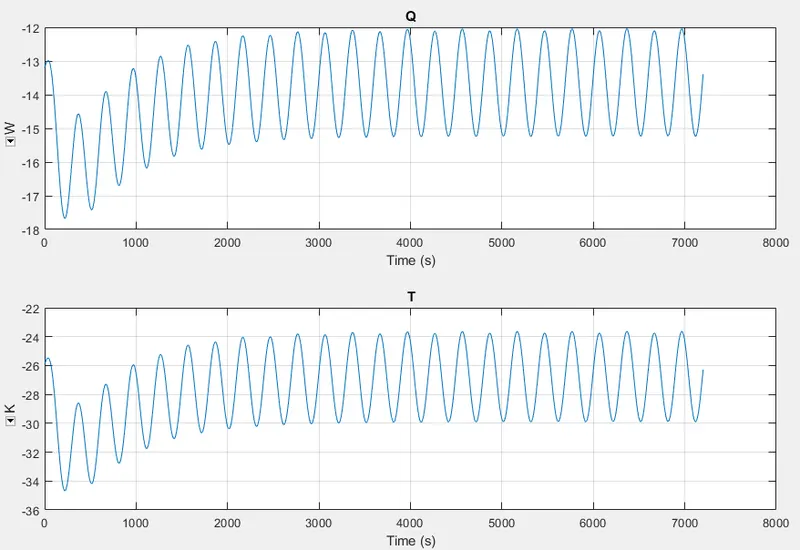
For cell 06 to 10:
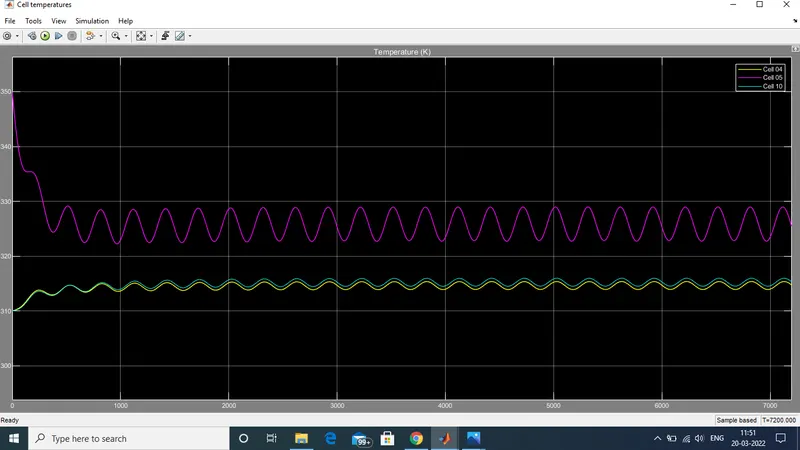
Test 5: Ambient temperature = 299.1 K , Cell from 01 to 04 is set to 310K , Cell 05 is set at 350K , Cell 06 to 10 set to 310K. For Cells to set the temperature we double click on the cell we get configuration parameters and at bottom we see initial cell temperature there we can change the temperature of cells.
Temperature graph:
SOC:
Condection:
For cell 04 to 05:
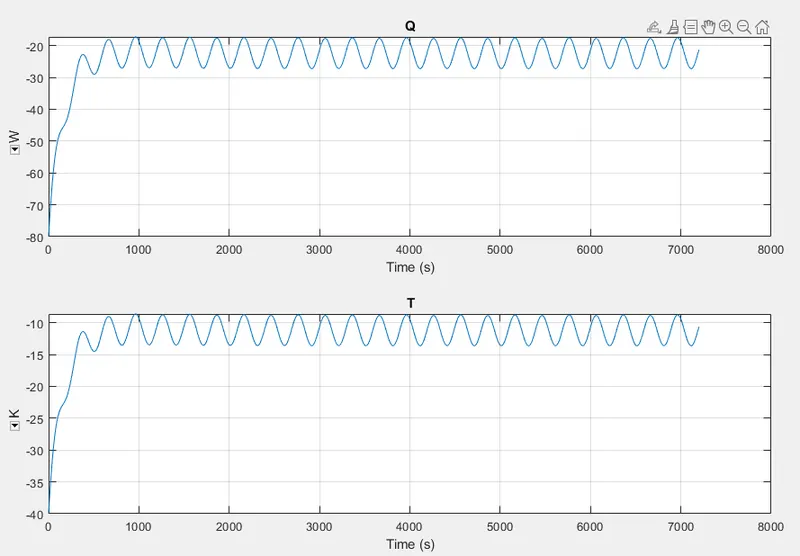
For cell 10 to 11:
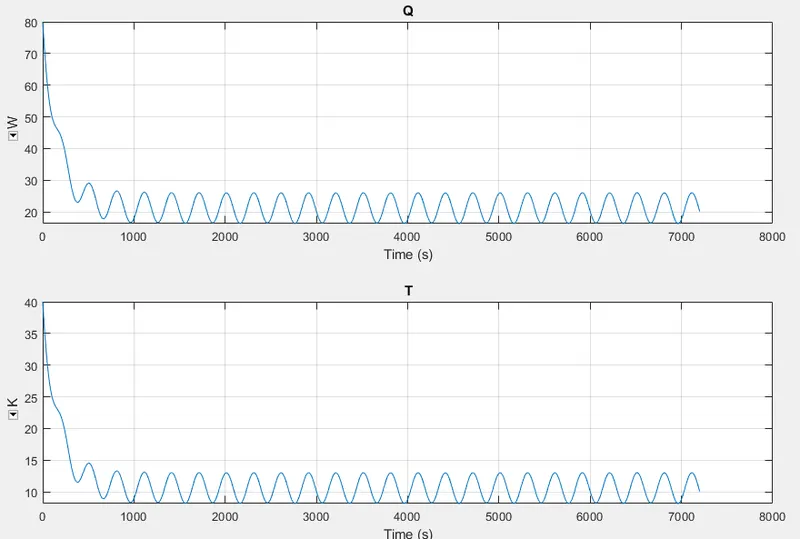
convection:
For cell 01 to 04:
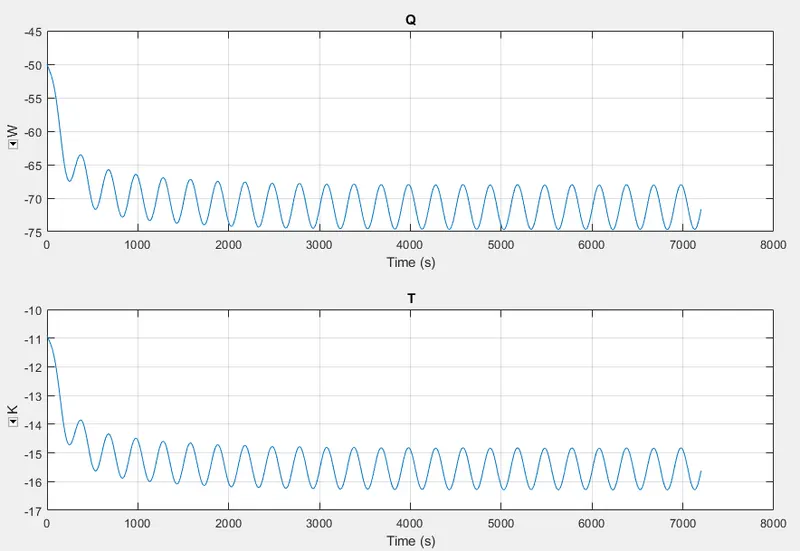
For cell 05:
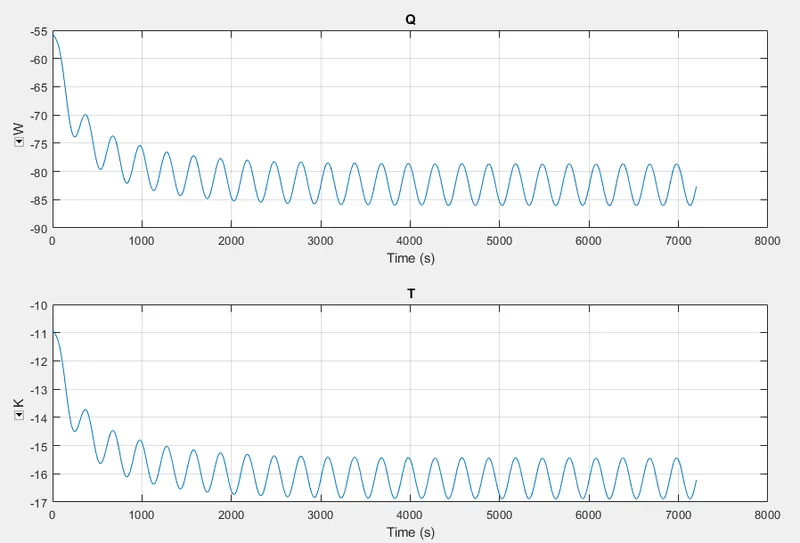
For cell 06 to 10:
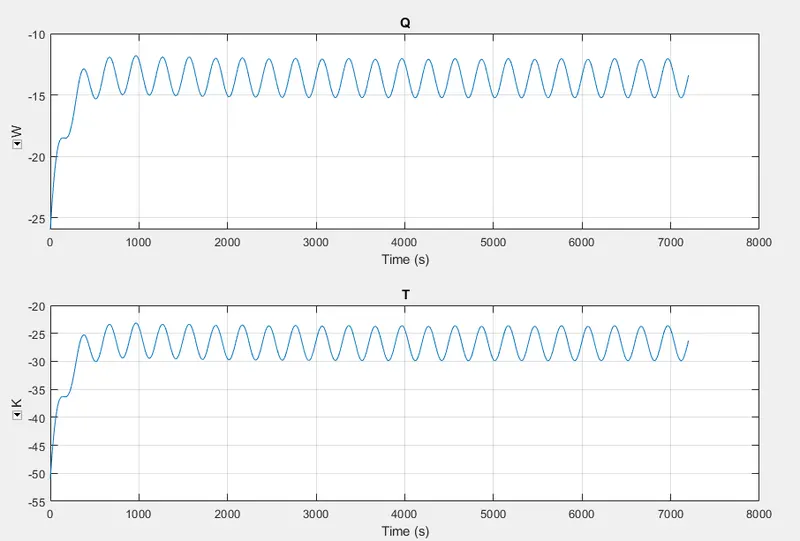
Here we have completed all the 5 test cases. In all the test case we see that what ever may be the starting temperature of batteries the perfect cell comes to 315 K temperature and gets stable and the faulty one will achieve more temperature than perfect cell i.e 225 K.
The SOC in all the test case is same i.e. from 0% to some where around 53% nd is repeated till 7200 sec.
For all conduction graph we see that for faulty cell the heat transfer coefficient and the thermal conductivity value decreases hence the heat transfer also decreases causing higher temperature of the faulty cell. Where as for all perfect cell the value of the heat transfer coefficient and the thermal conductivity is increasing which helps increase the heat transfer rate and hence keep the cell temperature low.