Project 2 Thermal modeling of battery pack
Objective:
For a 10 cell series lithium ion battery model, simulate the thermal effects and compare life cycle performance at various temperatures, charge & discharge rates using MATLAB.
Introduction:
In series, cells are joined end to end so that the same current flows through each cell. In case if the cells are connected in series the emf of the battery is connected to the sum of the emf of the individual cells. Suppose we have multiple cells and they are arranged in such a way that the positive terminal of one cell is connected to the negative terminal of the another and then again the negative terminal is connected to the positive terminal and so on, then we can that the cell is connected in series.
If,
Nominal voltage (V) = 3.3V
Number of cells in series = 10
Total voltage = 3.3*10 = 33V
Cell capacity = 2.9,4.1,4.1 Ah
Thermal mass = 30000 J/K
If,
T = Temparature of battery at time 't' (in K)
Ts = Source temperature (in K)
Ti = Initial tempearture of battery (in K)
m*Cp = Thermal mass (in J/K)
h = Heat transfer coefficient (in W/m^2 K)
A = Contact area (in m^2)
t = time (in sec)
T = Ts - (Ts - Ti)* e(-hAt/(m*Cp))
For example,
If,
Ts = 350
Ti = 298.15
m*Cp = 30000
h = 20
A = 0.1
t = 4hrs = 4*3600 = 14400 sec
T = 350 - (350-298.15)*e(-20*0.1*14400/(30000)) = 330.147 K ..................................(1)
Simulink procedure:
File: https://drive.google.com/file/d/10W9nteg7RpCnalM6kBONpv7lrSOaeCt0/view?usp=sharing
Blocks Used:
Sine wave: Alternating current for charging and diacharging the battery is done using Sine wave.
Controlled current source: Using this the current supplied is controlled.
Batter (Table based): Table based instrumented battery is used. The block calculates no-load voltage as a function of charge level and optional temperature using lookup tables and includes several modeling options.
Convective heat transfer: Heat transfer due to convection is considered. Appropriated area and heat transfer coefficient is given.
Temperature source: Ambient temerature is given through this temperature source.
Temperature sensor: Increase in battery temperature is sensed using Temperature sensor.
GoTo:
From:
Display:
Scope:
Add:
Product:
Solver configuration:
Electrical referance:
Procedure:
- Open Simulink and go to blank model.
- Firstly input the Sine wave block. This sine wave wiill produce charge/discharge current which is further controlled using a Controlled current source block. Amplitude of the current is decided according the discharge and charge current characteristics. Here we have used a 3A and 6.4A current amplitude. Frequency of 0.00087266 Hz is used. Phase and Sample time are kept 0.
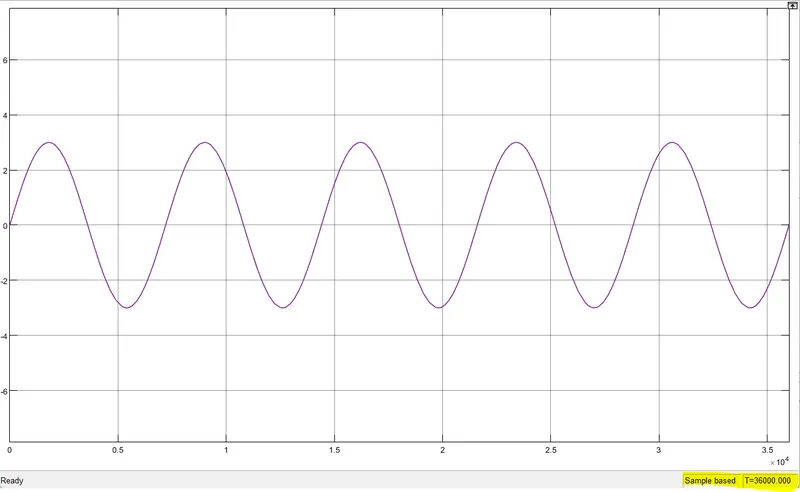
Figure-1: 3A amplitude for 10 hrs
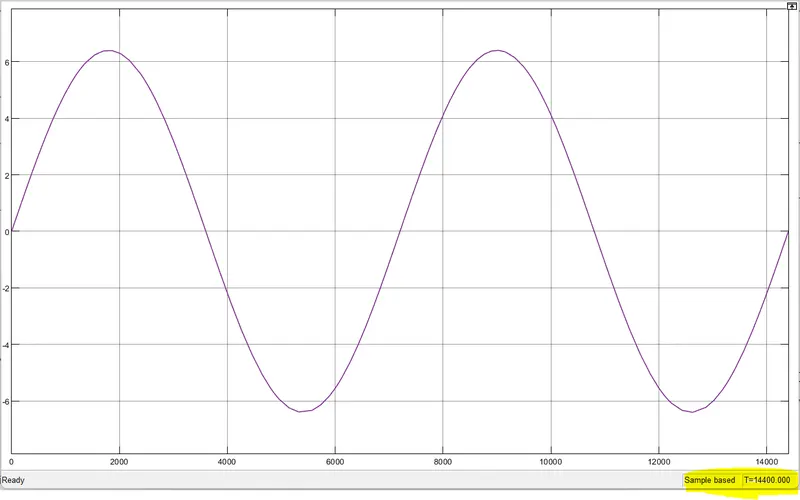
Figure-2: 6.4A amplitude for 4 hrs
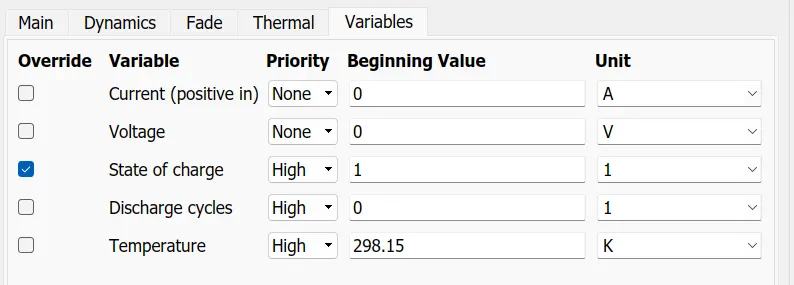
- 10 Table based Batteries are included and positive of one cell is connected to negative of other. In seris Voltage is added therefore total voltage of the the battery is around 33V and final Ah rating is between 2.9 to 4.2. The block calculates no-load voltage as a function of charge level and optional temperature using lookup tables. Charge dynamcs and self discharge are not included. Thermal mass, terminal resistance and begining SOC and Temperature are shown below,
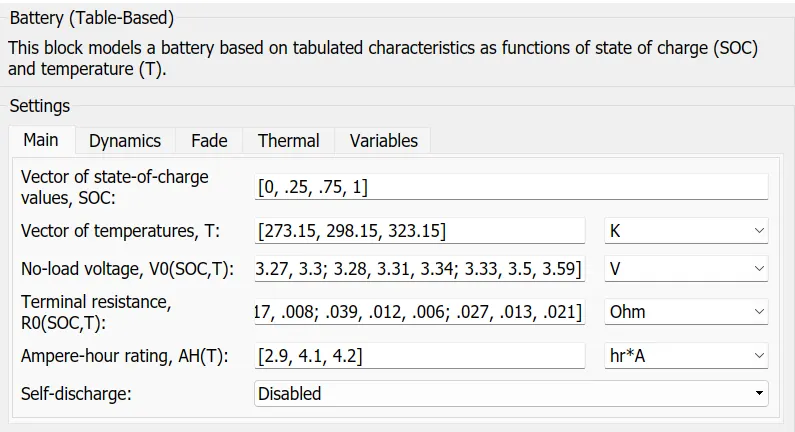
Figure-3: Open circuit voltage and Ah rating of the battery

Figure-4: Thermal mass of battery
- External source is used to heat the cells. Convective heat transfer is done. 6th cell of the battery is used as a fault cell which means, it is heated separately. For upper and lower cell modules, temperature source of 300K is used and for the fault cell, temperature is changed from 320 K to 350 K. Heat transfer coefficient of 20 W/m^2K and Contact area of 0.1 m^2 is used per cell. Temperature sensor block is used to see the change in cell temperature.
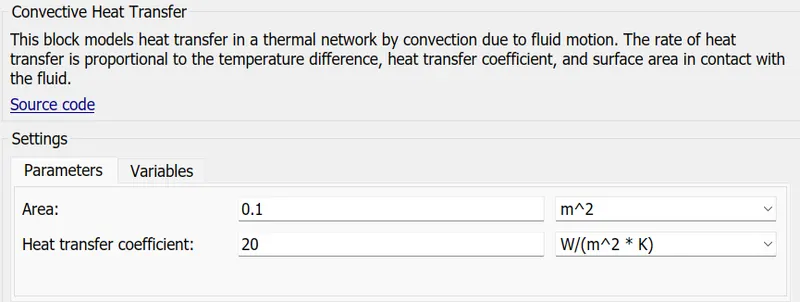
Figure-5: CHT
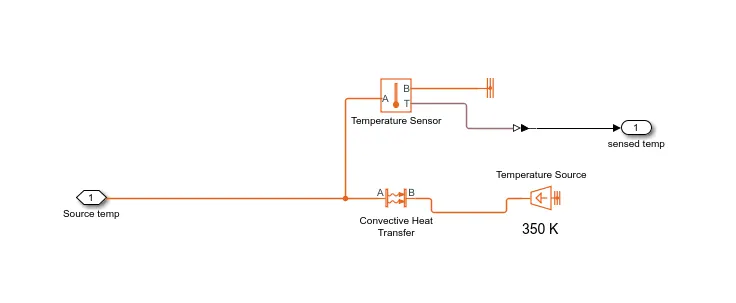
Figure-6: External source heat transfer blocks
- Because we are using an Instrumented type battery model, Soc calculation is done automatically. Average of the SOC of upper cells and lower cells are done separately and are compared with the SOC of fault cell. Change in SOC due to external temperature and input AC discharge and charge rate is monitored.
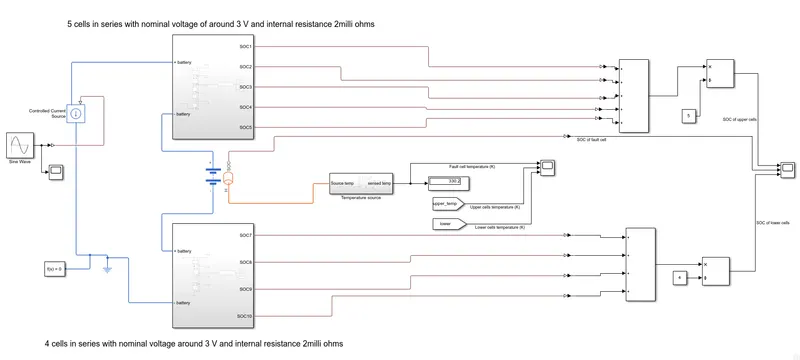
Figure-7: Final blockset
Results:
- Case-1: Input amplitude of 6.4 and source temperature to fault cell is 320K. Simulation is run for 4hrs
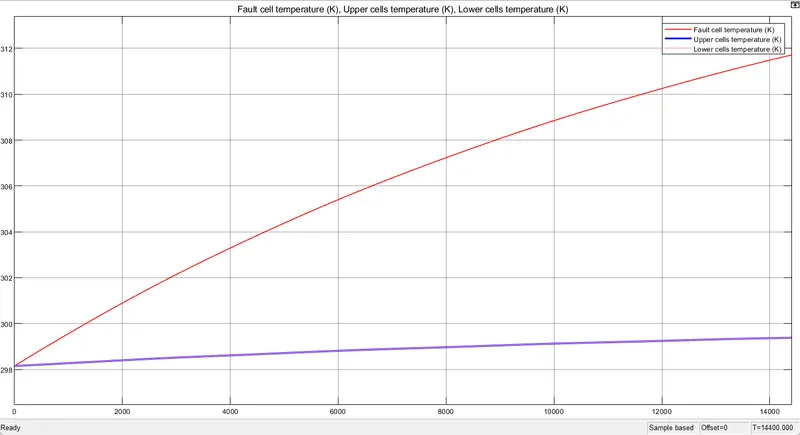
Figure-8: Temperature rise of fault cell as compared to other cells
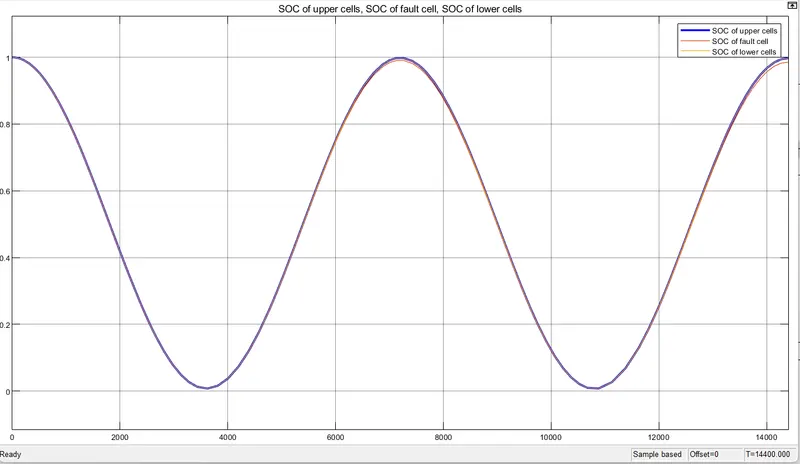
Figure-9: SOC of fault cell as compared to other cells
- Case-2: Input amplitude of 6.4 and source temperature to fault cell is 335K. Simulation is run for 4hrs
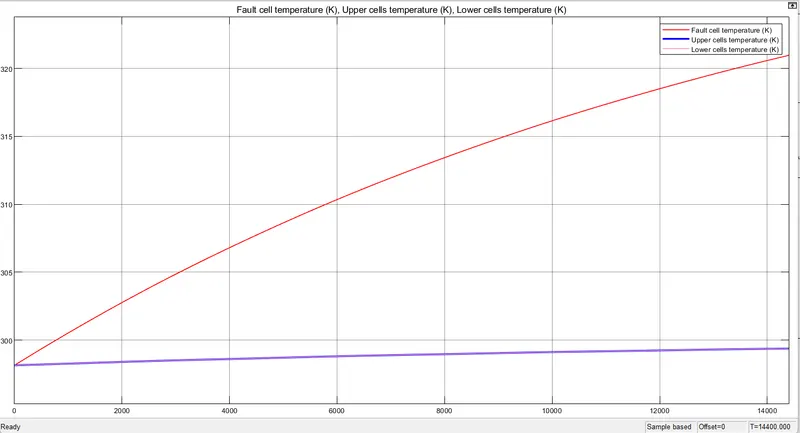
Figure-10: Temperature rise of fault cell as compared to other cells
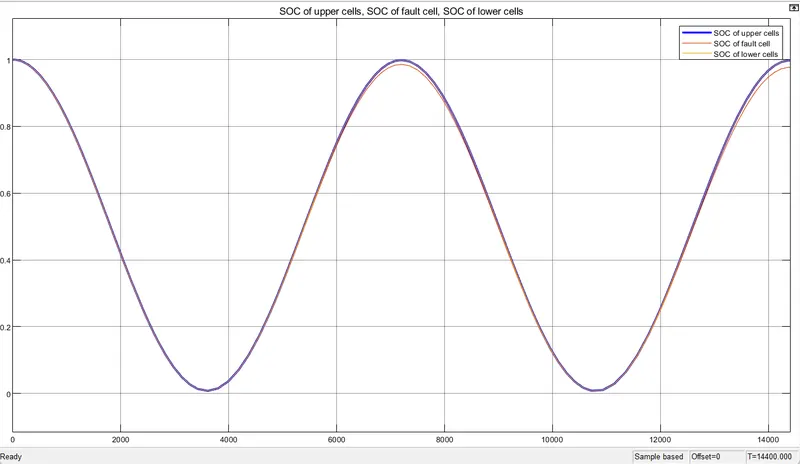
Figure-11: SOC of fault cell as compared to other cells
- Case-2: Input amplitude of 6.4 and source temperature to fault cell is 350K. Simulation is run for 4hrs
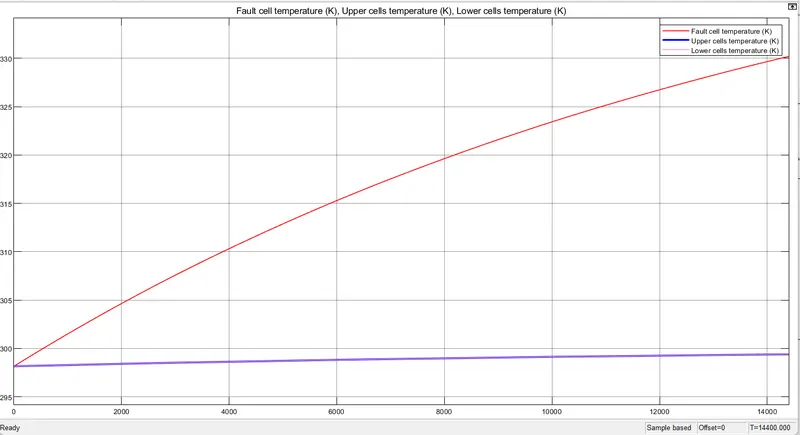
Figure-12: Temperature rise of fault cell as compared to other cells
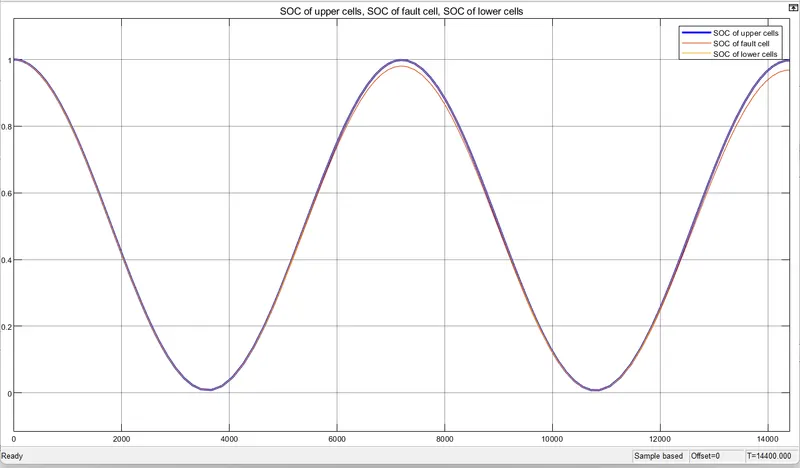
Figure-13: SOC of fault cell as compared to other cells
- Case-4: Input amplitude of 3 and source temperature to fault cell is 320K. Simulation is run for 10hrs
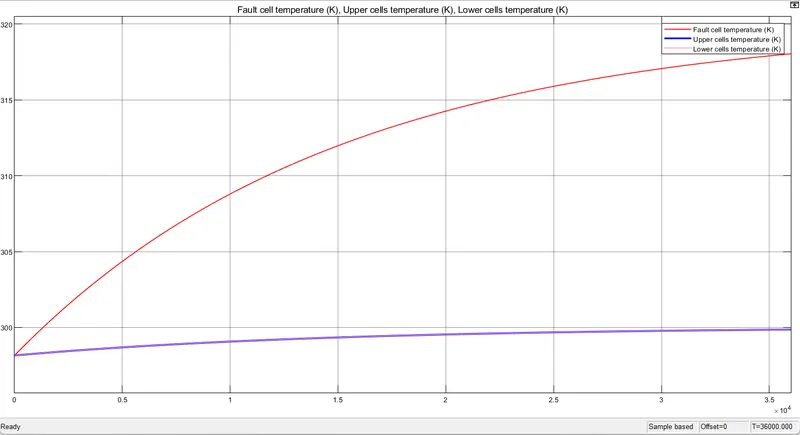
Figure-14: Temperature rise of fault cell as compared to other cells
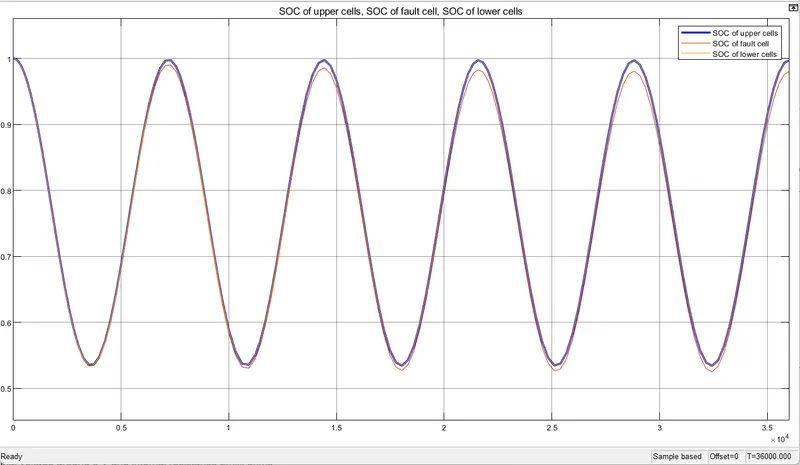
Figure-15: SOC of fault cell as compared to other cells
- Case-5: Input amplitude of 3 and source temperature to fault cell is 335K. Simulation is run for 10hrs
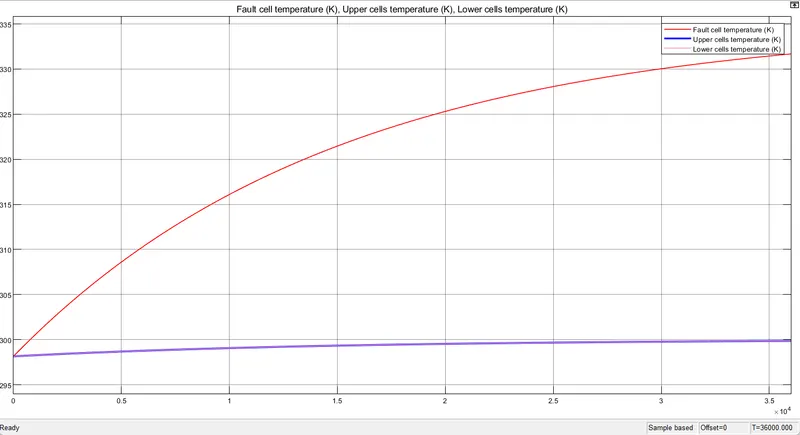
Figure-16: Temperature rise of fault cell as compared to other cells
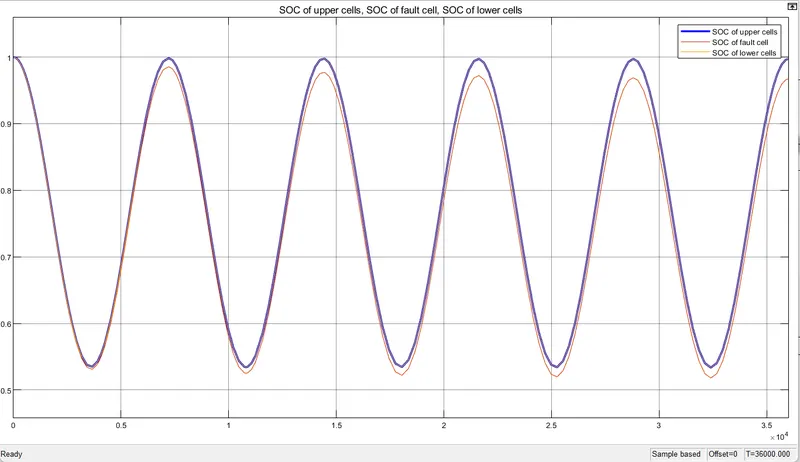
Figure-17: SOC of fault cell as compared to other cells
- Case-6: Input amplitude of 3 and source temperature to fault cell is 350K. Simulation is run for 10hrs
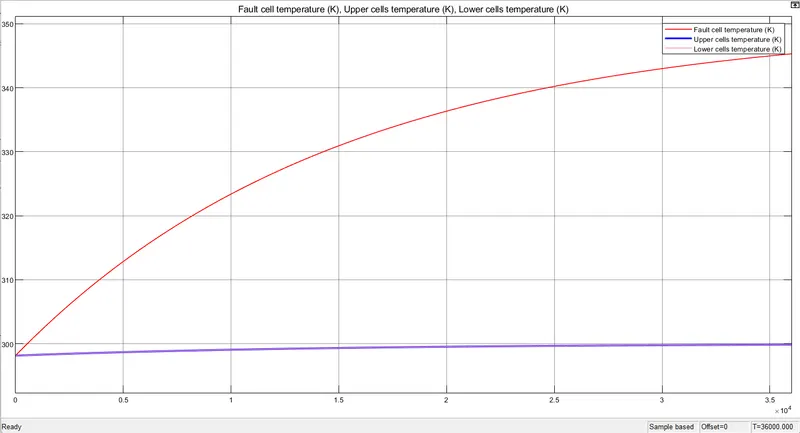
Figure-18: Temperature rise of fault cell as compared to other cells
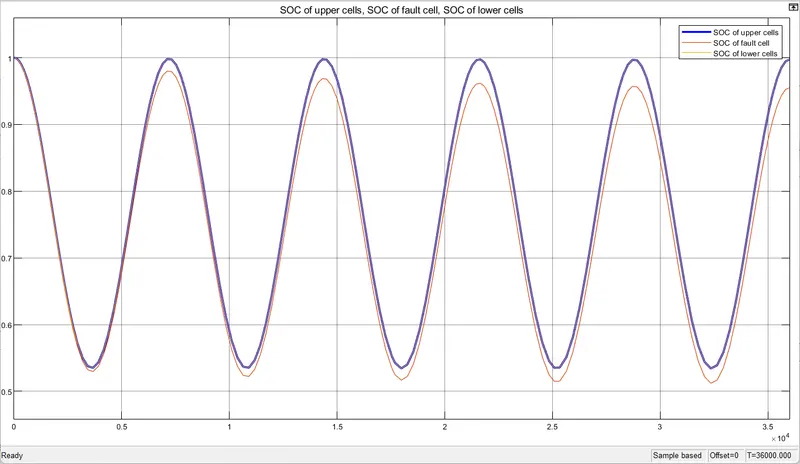
Figure-19: SOC of fault cell as compared to other cells
Table-1
| Input-3A,10 Hrs | Input-3A,10 Hrs | Input-3A,10 Hrs | Input-3A,10 Hrs | Input-6.4A,4 Hrs | Input-6.4A,4 Hrs | Input-6.4A,10 Hrs | Input-6.4A,4 Hrs | ||
| Temperature | Fault cell Temperature | SOC fault cell | SOC upper cells | SOC lower cells | Fault cell Temperature | SOC fault cell | SOC upper cells | SOC lower cells | |
| 320 K | 318 | 98 | 99.75 | 99.75 | 311.7 | 98.5 | 99.8 | 99.8 | |
| 335 K | 331.7 | 96.5 | 99.7 | 99.7 | 321 | 97.7 | 99.7 | 99.7 | |
| 350 K | 345.3 | 94 | 99.6 | 99.6 | 330.2 | 96.8 | 99.7 | 99.7 |
Conclusion:
- From table-1, it is clear that for an input of 3A, initial value of SOC every cycle for a fault cell decreases as the temperature increases. Effect of fault cell is visible on the other cell temperatures as well, as there SOC also decreases every cycle.
- After 10 hrs, for a 3A input, Fault cell temperature increases from 298.15 K to 318K for 320K source, to 331.7K for 335K source and to 345.3 K for 350 K source. This can also be verified using (1)
- Similarly, from table-1, it is clear that for an input of 6.4 A, initial value of SOC every cycle for a fault cell decreases as the temperature increases. Effect of fault cell is visible on the other cell temperatures as well, as there SOC also decreases every cycle.
- After 4 hrs, for a 6.4 A input, Fault cell temperature increases from 298.15 K to 311.7K for 320K source, to 321.7K for 335K source and to 330.2 K for 350 K source.