Project 1 - Parsing NASA thermodynamic data
Aim:
- Extracting coefficients from a NASA file and calculating Enthalpy, Entropy and Specific heat.
- Molecular weight calculation of each specie in the file.
- Plotting enthalpy,entropy and specific heat from the local temperatures.
- Saving the plots as images with appropriate names and dumping them in separate folders for each species with suitable name.
Software used: Matlab-2019.
Introduction:
Parsing in computer languages refers to syntactic analysis of the input code into its components parts in order to facilitate the writing of compilers and interpreters. It can be used to describe split or separation. Parsing a file means reading in a data stream of some sort and building an in memory model of the semantic content of that data.
In the current project, NASA made a file consisting thermodynamic data to calculate Enthalpy, Entropy and Specific heat. We need to extract that data and solve the following equations and plot the results.

Procedure and Results:
- Open matlab and go to editor window, write clc, cear all and close all.
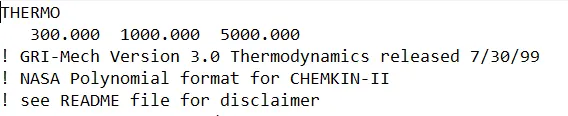
- After downloading the 'Thermo.dat' file, we will open it in matlab using 'fopen' command. fopen means file open. Synrax is fopen('File name','r'), Here 'r' means reading the file. We store this in a variable named 'f1'. Now the first five lines of Thermo.dat file are not of use, therefore we use 'fgetl(f1)' command to go to the next line of the file. After first two lines, three comments are there which are omitted using a for loop.
clear all
clc
close all

f1 = fopen('THERMO.dat','r');
A = fgetl(f1);
C = fgetl(f1)

B = strsplit(C,' ');
lower_temp = str2num(B{2});
mid_temp = str2num(B{3});
high_temp = str2num(B{4});
for i=1:3
    fgetl(f1)
end - Now the main line is the one with 'O' specie in it. There are 53 species in this file. Therefore we can start with a for loop. Variable 'G' represents a string. 'Strsplit' command is used to separate the line in which space bar is present. This is stored in 't'. 't1' represents the first specie of the line. Now to get the local tempearatures, 'str2num' command is used, to convert the strings of the line to numbers.
- As of now we have the local tempeartures of all the species. Now we jump to the next line and extract the coefficients. In the next line no space is present but E is common, therefore we first find the position of letter E in the line by using 'findstr' command. A represents the position of E in the line. We also observe that after E always 3 numbers are present, therefore we extract the number using simple ':' and store it in x1. Now this x1 is still a string, therefore we convert it into a number by using command 'str2num'. Same procedure is observed for all the 14 coefficients of a particular specie. As we already have a for loop for all 53 species, all 14 coefficients of 53 soecies can be extracted.
- Now we make a separate folder to save the respective specie plots , we make that using 'mkdir' command.
- To calculate the specific heat, entropy and enthalpy using above equations, we need local temperatures. We already have them but we use linspace command to make temperature array of 100 elements. We need to use first seven coefficients for high temperatures therefore we use 'if' command. For low temperature, we use the other seven coefficients. R is the gas constant, whose value is defined above (8.314). Later we plot the graphs of enthalpy, entropy and specific heat vs temperatures. To save these plots, we change the directory of each specie using 'cd' command. We use 'saveas' command to save the plots in png format.
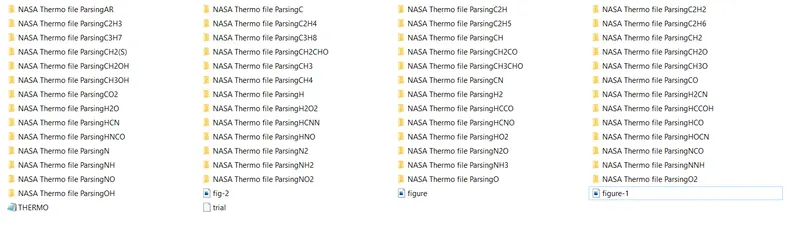
Figure-2 Folder for each specie
Plots for Oxygen:
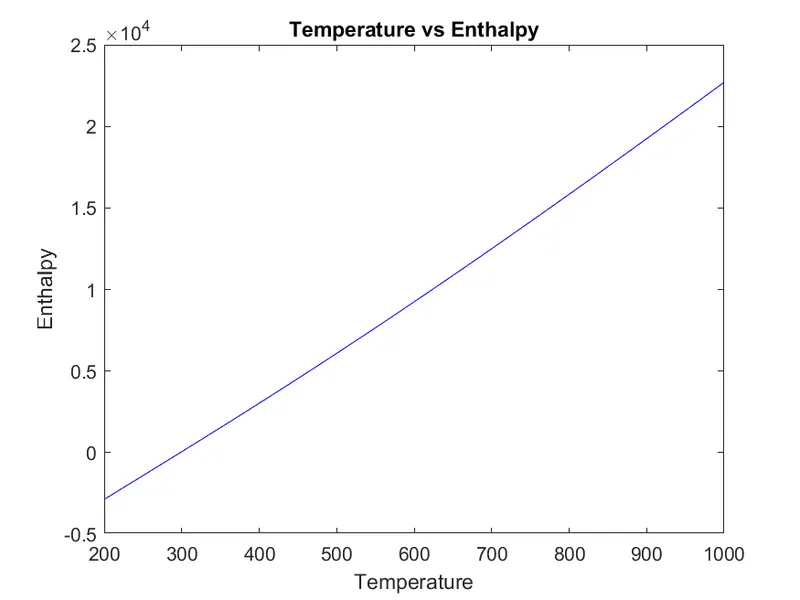
Figure-3 Temperature vs Enthalpy
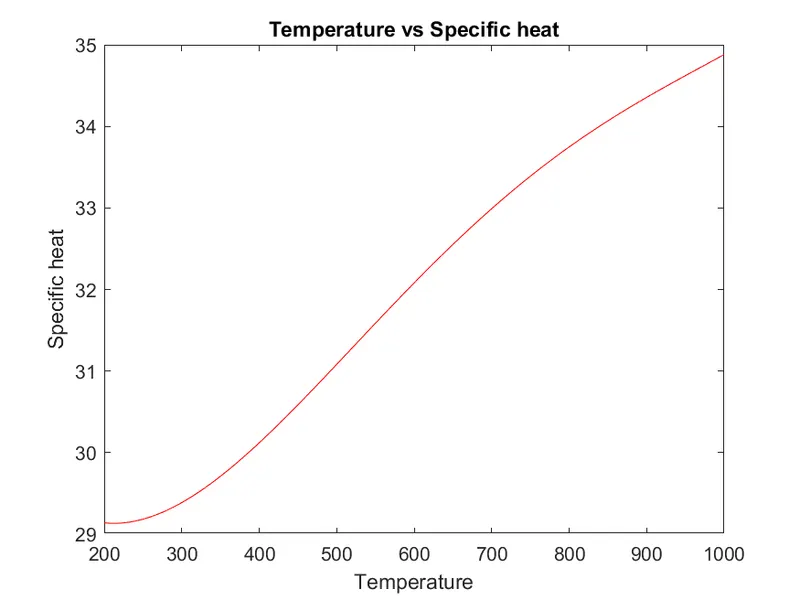
Figure-4 Temperature vs Specific heat
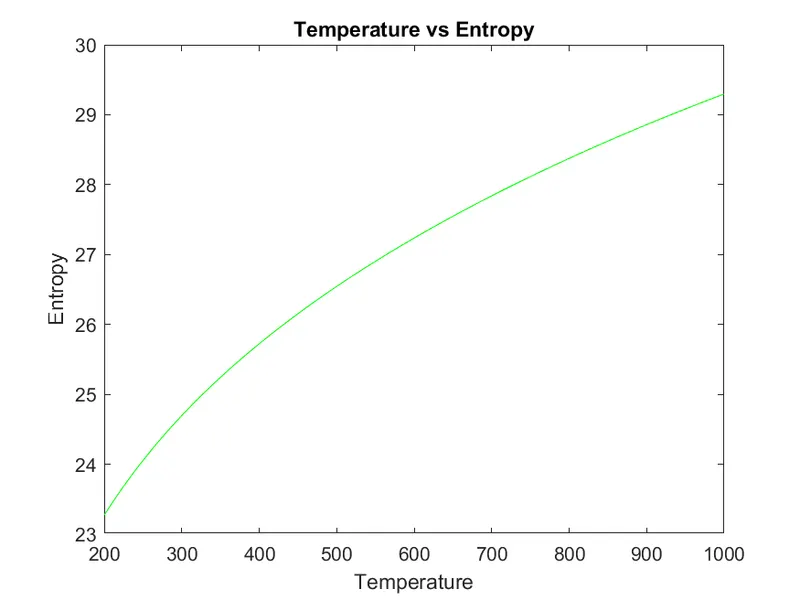
Figure-5 Temperature vs Entropy
Plots for Nitrogen:
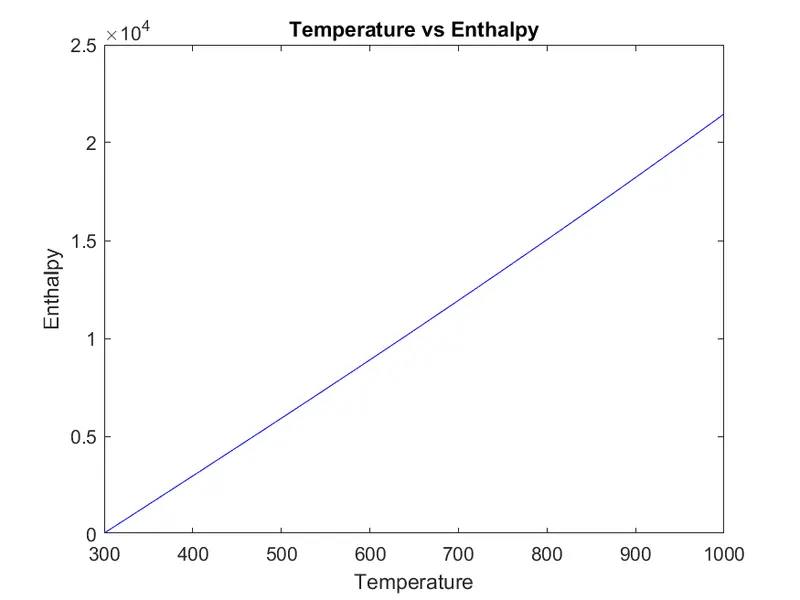
Figure-6 Temperature vs Enthalpy
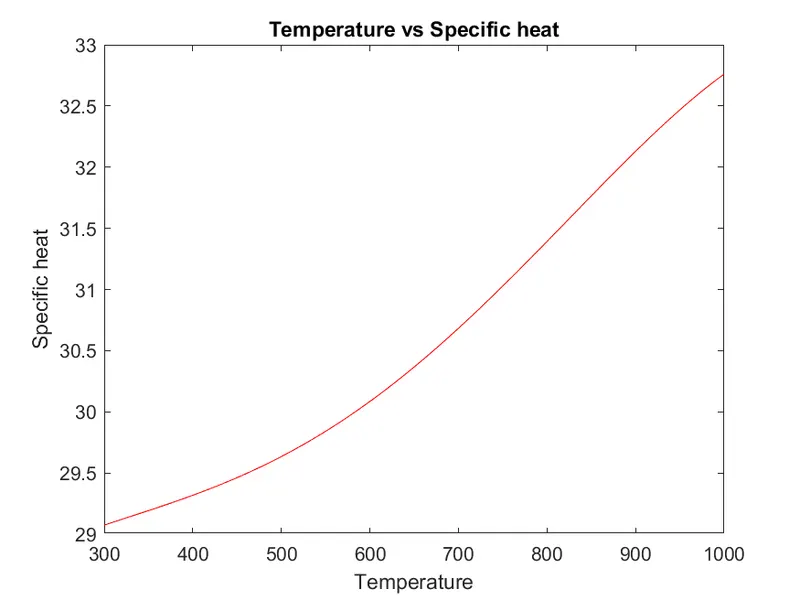
Figure-7 Temperature vs Specific heat
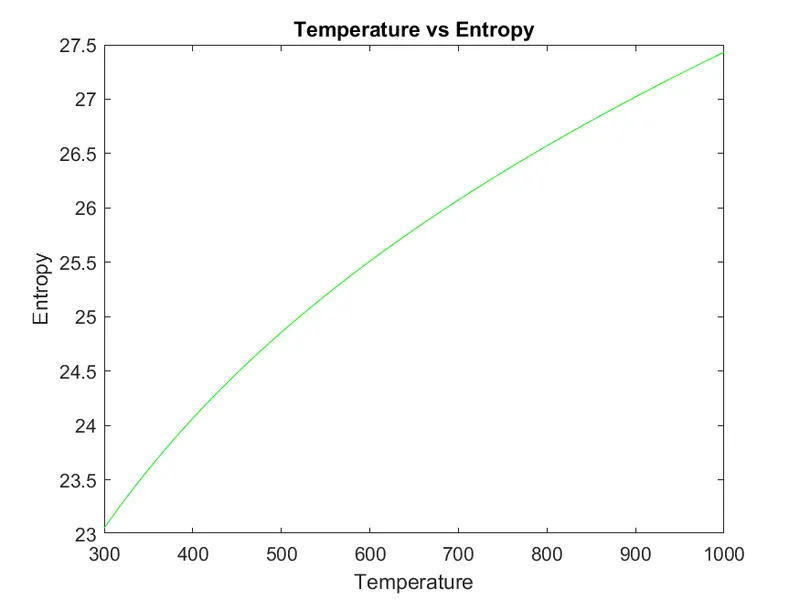
Figure-8 Temperature vs Entropy
Plots for Carbon dioxide
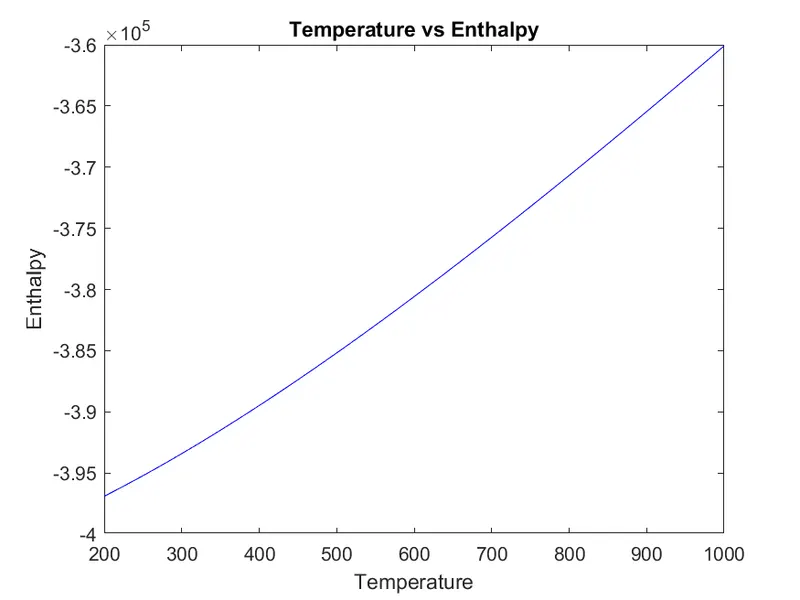
Figure-9 Temperature vs Enthalpy
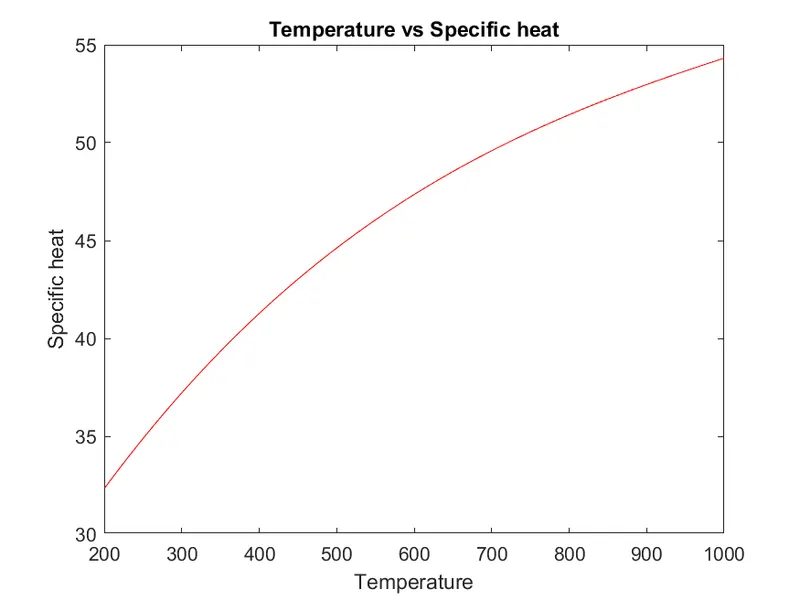
Figure-10 Temperature vs Specific heat
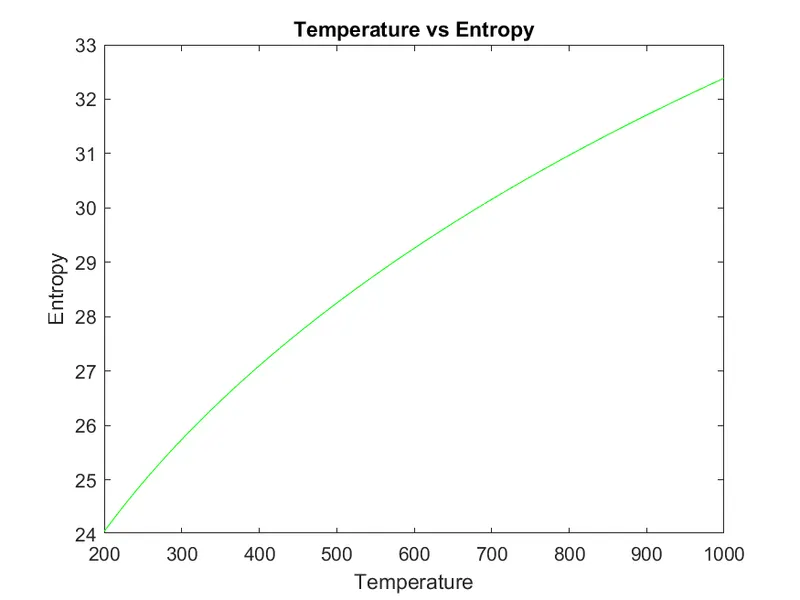
Figure-11 Temperature vs Entropy
- Last bit of the challenge is to find the molecular weight of each specie. For that first we define mol = 0 (molecular weight initially). As all the species are made up of O,H,C,N ans Argon , therefore we define these elements and write there atomic weight in matrix 'atomic_no'. Now many of the dpecies are not single atoms, either they are molecules of same atoms or other species, therefore we use two for loops to consider that value as well. 'strcmp' command is used to compare two strings. If the string of elements array and species array(t1) are same then atomic weight is added to mol otherwise it falls out of if command. Until now we have single elements molecular mass in species name(t1). We need to add according to molecular formula. First we convert the string to number using str2num command. Later we use atomic_no(position)*(n-1) formula to add molecular weight of other species. At last we display the molecular weight using 'sprintf' command.
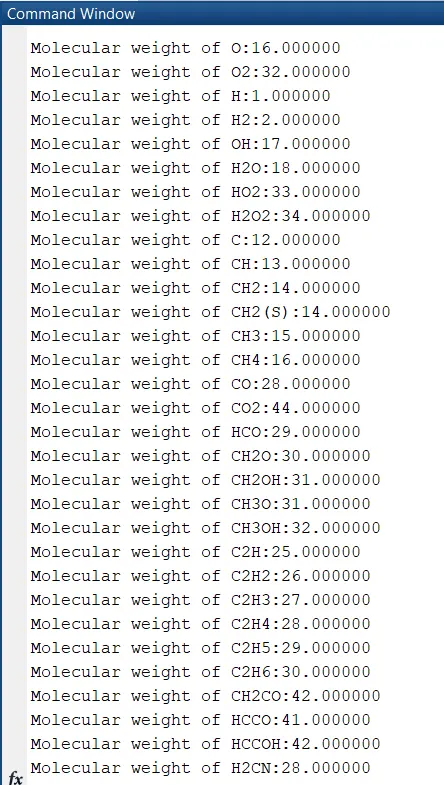
- At last we close the file using 'fclose' command.
Final code:
clear all
clc
close all

f1 = fopen('THERMO.dat','r');
A = fgetl(f1);
C = fgetl(f1)

B = strsplit(C,' ');
lower_temp = str2num(B{2});
mid_temp = str2num(B{3});
high_temp = str2num(B{4});
for i=1:3
    fgetl(f1)
end


for j=1:53 %% Number of variables
G = fgetl(f1);
t = strsplit(G,' ');

t1 = t{1}; %% Species name
Th = str2num(t{end-1});
Tm = str2num(t{end-2});
Tl = str2num(t{end-3});
%% First line coefficients


 H = fgetl(f1);
 A = findstr(H,'E');

 x1 = H(1:A(1)+3);%% 'H' ka 1 number inke bich m h
 a1 = str2num(x1);

 x2 = H(A(1)+4:A(2)+3);%% 'H' ka 2 number inke bich m h
 a2 = str2num(x2);

 x3 = H(A(2)+4:A(3)+3);%% 'H' ka 3 number inke bich m h
 a3 = str2num(x3);

 x4 = H(A(3)+4:A(4)+3);%% 'H' ka 4 number inke bich m h
 a4 = str2num(x4);

 x5 = H(A(4)+4:A(5)+3);%% 'H' ka 5 number inke bich m h
 a5 = str2num(x5);


 %% Second line coefficients
 I = fgetl(f1);
 B = findstr(I,'E');

 y6 = I(1:B(1)+3);%% 'I' ka 1 number inke bich m h
 a6 = str2num(y6);

 y7 = I(B(1)+4:B(2)+3);%% 'I' ka 2 number inke bich m h
 a7 = str2num(y7);

 y8 = I(B(2)+4:B(3)+3);%% 'I' ka 3 number inke bich m h
 a8 = str2num(y8);

 y9 = I(B(3)+4:B(4)+3);%% 'I' ka 4 number inke bich m h
 a9 = str2num(y9);

 y10 = I(B(4)+4:B(5)+3);%% 'I' ka 5 number inke bich m h
 a10 = str2num(y10);


 %% Third line coeffiecients
 J = fgetl(f1);
 C = findstr(J,'E');

 z11 = J(1:C(1)+3);%% 'J' ka 1 number inke bich m h
 a11 = str2num(z11);

 z12 = J(B(1)+4:C(2)+3);%% 'J' ka 2 number inke bich m h
 a12 = str2num(z12);

 z13 = J(B(2)+4:C(3)+3);%% 'J' ka 3 number inke bich m h
 a13 = str2num(z13);

 z14 = J(B(3)+4:C(4)+3);%% 'J' ka 4 number inke bich m h
 a14 = str2num(z14);

 %% Create folder
 folder = mkdir(['D:\Skill Lync\Matlab\NASA Thermo file Parsing\NASA Thermo file Parsing',t1]);
 %% Equations
T = linspace(Tl,Th,100);
R = 8.314;
for k = 1:length(T)
if T(k)>Tm
        cp = R*(a1+(a2.*T)+(a3.*(T.^2))+(a4.*(T.^3))+(a5.*(T.^4)));
        h = (R.*T)*(a1+(a2.*T)/2+(a3.*T.^2)/3+(a4.*T.^3)/4+(a5.*T.^4)/5+(a6./T));
        s = ((a1.*log(T))+(a2.*T)+(a3.*T.^2)/2+(a4.*T.^3)/3+(a5.*T.^4)/4+a7)*R;
end

if    T(k)<Tm
    cp = R*(a8+(a9.*T)+(a10.*(T.^2))+(a11.*(T.^3))+(a12.*(T.^4)));
        h = (a8+(a9.*T)/2+(a10.*T.^2)/3+(a11.*T.^3)/4+(a12.*T.^4)/5+(a13./T))*R.*T;
        s = (a8.*log(T))+(a9.*T)+(a10.*T.^2)/2+(a11.*T.^3)/3+(a12.*T.^4)/4+a14;
end

end
%% Plots
figure (1)
plot(T,cp,'color','r'); xlabel('Temperature'); ylabel('Specific heat');title('Temperature vs Specific heat');
figure (2)
plot(T,h,'color','b'); xlabel('Temperature'); ylabel('Enthalpy');title('Temperature vs Enthalpy');
figure (3)
plot(T,s,'color','g'); xlabel('Temperature'); ylabel('Entropy');title('Temperature vs Entropy');

%% Saving
save =  (['D:\Skill Lync\Matlab\NASA Thermo file Parsing\NASA Thermo file Parsing',t1]);
cd(save);
saveas(1,'Specific heat.png');
saveas(2,'Enthalpy.png');
saveas(3,'Entropy.png');
%% Molecular mass
mol = 0;
elements = ['O','C','H','N','A'];
atomic_no = [16 12 1 14 39.5];
for v = 1:length(t1)
    for w = 1:length(elements)
        if strcmp(t1(v),elements(w));
            mol = mol+atomic_no(w);
            position = w;
        end
    end
    x = str2num(t1(v));
    if x>1
        mol = mol+(atomic_no(position)*(x-1));

end
end
disp(sprintf('Molecular weight of %s:%f',t1,mol));
end
fclose(f1);
Conclusion:
- Enthalpy,Entropy and Specific heat plots vs Temperature are shown.
- Different folders and there directories are shown
- Molecular mass of each specie is calculated.